Cardano Tests Critical Support as ETF Speculation Meets Heavy Selling Pressure
Market Structure Shifts Lower
- ADA plunges 34% monthly despite institutional ETF filings from T. Rowe Price
- Momentum exhaustion signals complete at 32.7 RSI – matching August capitulation levels
- Bulls defend $0.387 support after six-month grind lower erased 58% of value
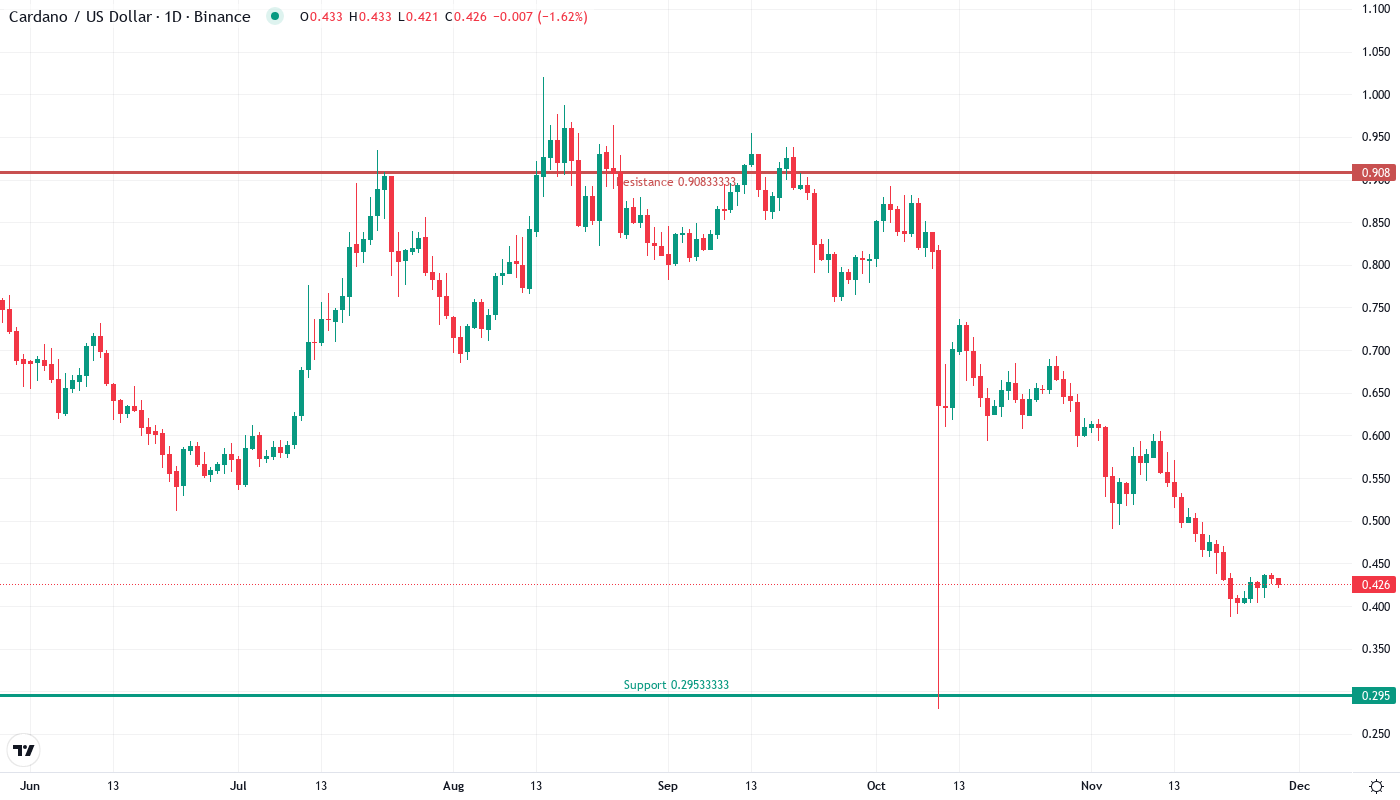
Cardano’s price action tells a story of institutional hope meeting brutal market reality. The cryptocurrency dropped a devastating 34.06% over the past month to $0.426, even as T. Rowe Price filed for a new active crypto fund that includes ADA exposure. This disconnect between positive ETF developments and price performance has trapped retail traders who bought the news, while whale accumulation patterns suggest smart money is quietly positioning for a potential reversal. The main question for traders is: can the $0.387 monthly low hold as genuine support, or will the ETF narrative fail to materialize before sellers overwhelm this level?
| Metric | Value |
|---|---|
| Asset | CARDANO (ADA) |
| Current Price | $0.43 |
| Weekly Performance | -1.62% |
| Monthly Performance | -34.06% |
| RSI (Relative Strength Index) | 32.7 |
| ADX (Average Directional Index) | 52.8 |
| MACD (MACD Level) | -0.05 |
| CCI (Commodity Channel Index, 20-period) | -64.26 |
RSI at 32.7 Matches Historical Capitulation Zones
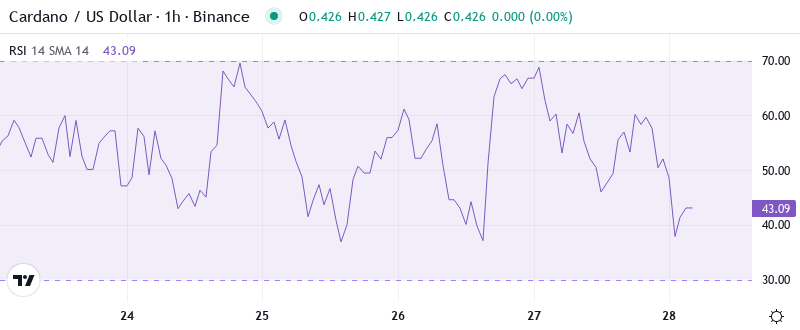
Reading the oscillator at 32.66 on the daily timeframe, traders see textbook oversold conditions that historically marked significant bottoms for Cardano. This level mirrors the August 2023 washout that preceded a 65% relief rally, though crucially, the momentum structure differs this time with RSI failing to reclaim the 40 level on recent bounces. What’s revealing is how RSI behaved during the T. Rowe Price ETF announcement – the indicator barely budged from oversold territory, suggesting the market had already priced in disappointment. So for swing traders, this persistent weakness below 40 means any bounces remain sell-the-rip opportunities until RSI convincingly breaks back above 45, confirming genuine buying pressure has returned.
ADX Climbs to 52.8 – Extreme Downtrend Conviction
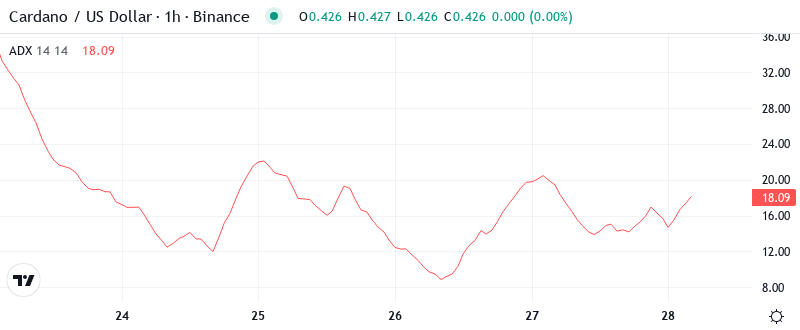
Trend strength readings paint an even more dramatic picture, with ADX surging to 52.80 – the highest directional movement reading since the May 2022 collapse. At this level, the ADX entry indicates that sellers maintain iron-grip control over price action, making counter-trend trades extremely dangerous. Basically, when ADX reads above 50, it signals one of those rare market moments where fighting the trend becomes financial suicide. The combination of extreme ADX with oversold RSI creates a paradox – yes, ADA looks cheap, but the selling pressure remains so intense that catching this falling knife requires exceptional timing. Therefore, day traders should suit their strategies to this trending environment by selling rallies rather than buying dips until ADX drops below 40.
Moving Averages Stack as Resistance Ceiling
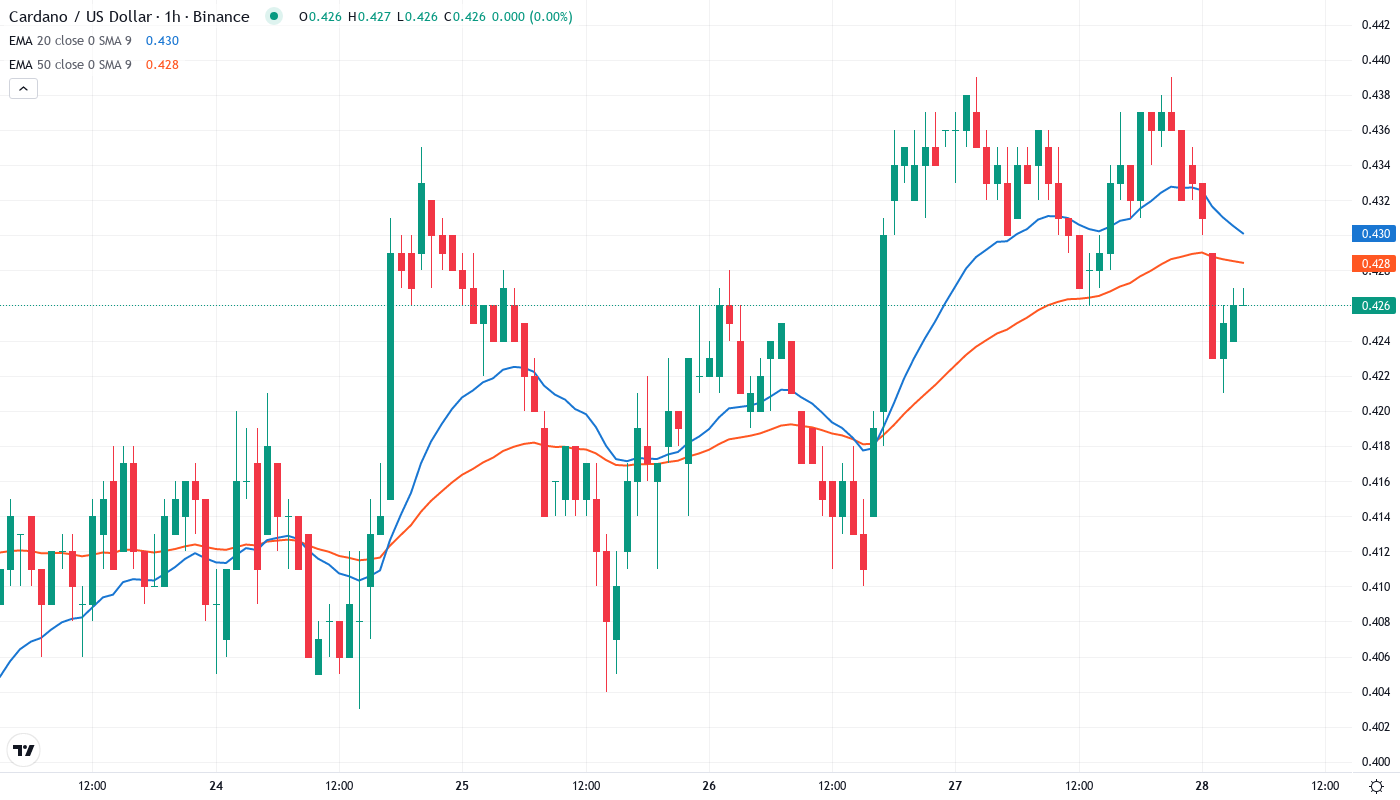
Price trades below the entire EMA ribbon, with each average now acting as overhead resistance. ADA sits beneath the 10-day ($0.438), 20-day ($0.471), and critically, the 50-day EMA at $0.504 – a level that rejected advances three times in December before finally breaking down. More telling is the compression between the 100-day ($0.641) and 200-day ($0.589) EMAs far overhead. This configuration resembles a bearish waterfall structure where any relief bounce faces multiple resistance layers. The 50-day EMA at $0.504 now transforms into a red line for bears to defend – if bulls can reclaim and hold above this level, it would signal the first structural shift in two months.
Support at $0.387 Faces Seventh Test Since June
Resistance stacks heavy between current levels and the psychological $0.50 mark, with the immediate ceiling at $0.438 (10-day EMA) followed by stronger resistance at $0.471 (20-day EMA). The monthly pivot at $0.499 adds another layer of selling pressure, creating a gauntlet for any recovery attempt.
Bulls defend their final stronghold at $0.387, the monthly low that’s now been tested six times since June. This level gains significance from the staking crisis news – with 7 million ADA at risk of loss in vulnerable pools, any break below $0.387 could trigger forced liquidations and accelerate the decline toward $0.30 psychological support.
The structure of the market signals seller dominance as long as price remains below $0.504. Each bounce weakens the $0.387 support through repeated tests, while the ETF speculation that initially provided hope now acts as a ceiling – traders who bought the T. Rowe Price news between $0.55-0.65 will likely sell any rally that approaches their underwater entry points.
ETF Timeline Makes $0.504 Reclaim Critical for Bulls
Bulls require a decisive daily close above $0.504 to invalidate the bearish structure and signal potential accumulation ahead of CEO-projected ETF launches. This move would flip the 50-day EMA from resistance to support while potentially triggering short covering that targets $0.65.
The bearish scenario accelerates if $0.387 fails on volume – this would trap recent ETF speculators and likely flush positions toward the next major support at $0.30, where the psychological round number meets 2023 lows. Given the staking vulnerability news, such a breakdown could cascade quickly.
With extreme oversold readings meeting powerful downtrend momentum, the most probable near-term path sees ADA establishing a bottom between $0.387-$0.426 before attempting a relief rally toward $0.471. The ETF narrative provides a fundamental floor, but technical repair requires time and evidence of genuine accumulation – not just hopeful speculation.