Cardano Slumps to Multi-Year Lows as Momentum Exhaustion Signals Capitulation Phase
Market Pulse
- ADA trades at $0.417, down 36.3% monthly in devastating decline that erased half its value since June
- RSI plunges to 29.59 on daily timeframe – first oversold signal since August washout
- Support architecture crumbles as price loses 50-day EMA at $0.578 and tests 2023 floor
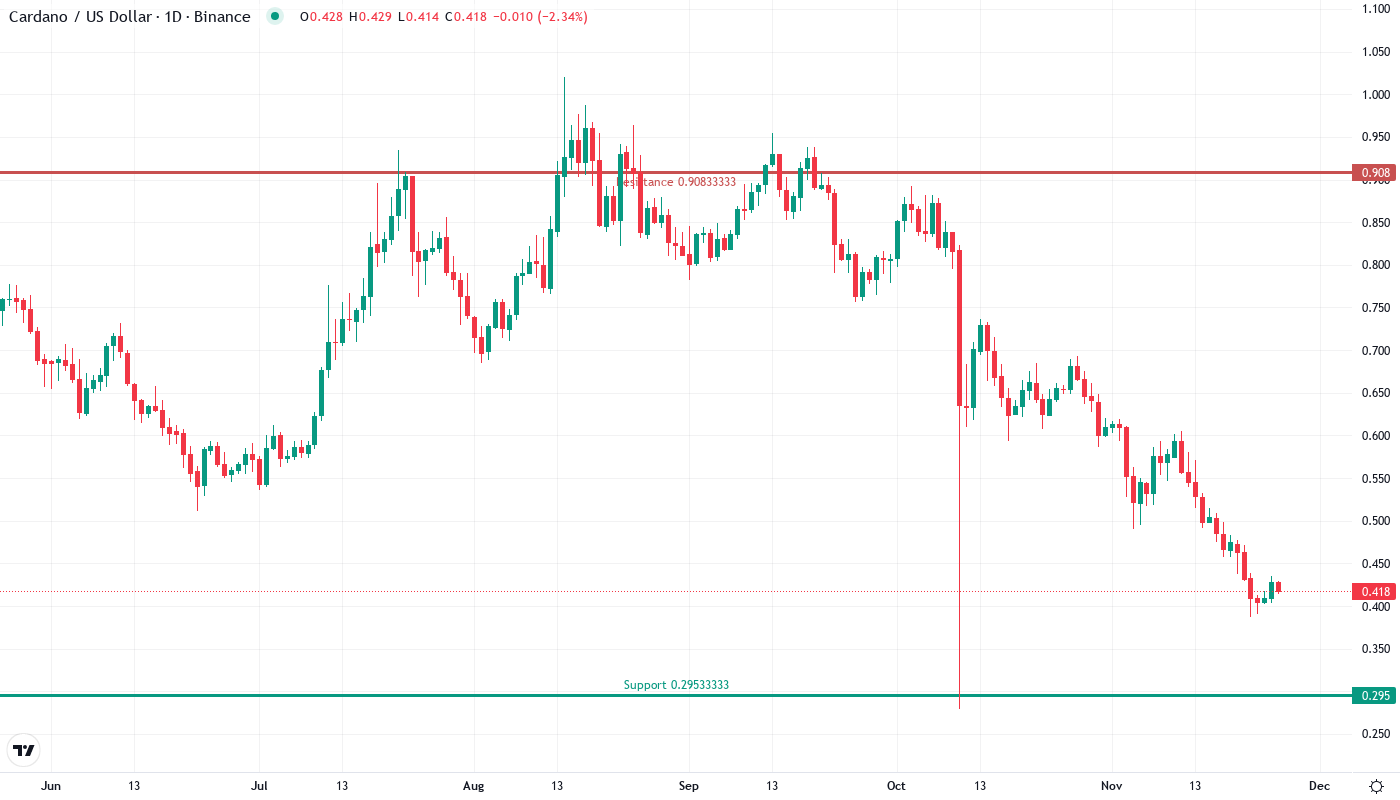
Cardano has suffered a devastating collapse over the past month, shedding 36.3% to trade at $0.417 – roughly $0.24 erased in four weeks. The altcoin’s decline accelerated despite positive treasury developments including a A$5 million loan approval for global exchange listings, suggesting broader market forces overwhelm fundamental improvements. The main question for traders is: has ADA found its floor at these multi-year lows, or does further downside await as the broader crypto correction deepens?
| Metric | Value |
|---|---|
| Asset | CARDANO (ADA) |
| Current Price | $0.42 |
| Weekly Performance | -10.52% |
| Monthly Performance | -36.34% |
| RSI (Relative Strength Index) | 29.6 |
| ADX (Average Directional Index) | 54.0 |
| MACD (MACD Level) | -0.06 |
| CCI (Commodity Channel Index, 20-period) | -91.62 |
RSI Drops to 29.59 – First Oversold Reading Since August Washout
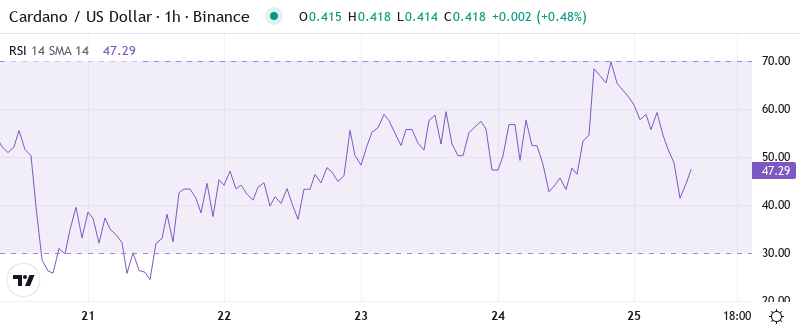
Reading the oscillator at 29.59 on the daily timeframe, traders see classic capitulation signals flashing for the first time since August’s market-wide flush. The momentum exhaustion comes after ADA spent most of November and early December grinding lower without relief, systematically breaking support levels that held throughout 2024. What’s revealing is how RSI barely budged despite the Cardano Foundation’s treasury-backed expansion news – a clear sign that sellers remain in control regardless of positive developments.
Similar RSI configurations in August preceded a 25% relief bounce within two weeks, though that rally ultimately failed to sustain. So for swing traders, this oversold extreme presents a clear mean-reversion opportunity, but with the critical caveat that catching this falling knife requires tight risk management. The weekly RSI at 34.2 confirms the oversold condition extends beyond just daily fluctuations, suggesting any bounce attempt needs to prove itself before traders commit serious capital.
ADX at 32.16 Confirms Mature Downtrend Nearing Potential Exhaustion
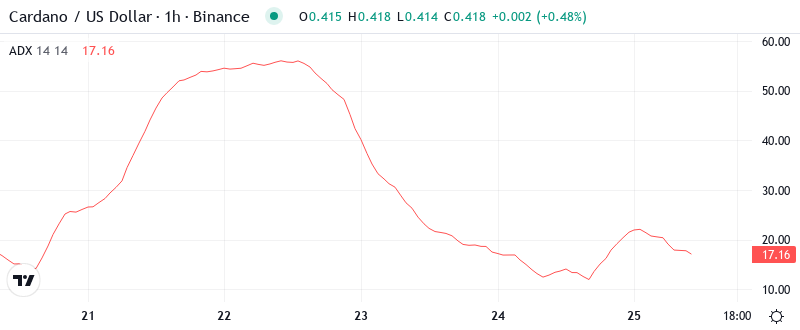
At the level of 32.16, the ADX entry indicates that the downtrend has significant power behind it – not quite at extremes, but certainly beyond the choppy, directionless action that plagued ADA through October. Basically, being in this zone means sellers have maintained consistent pressure for weeks, which explains why positive news like December’s NIGHT token launch countdown failed to spark any buying interest. The elevated ADX reading suggests this isn’t just profit-taking but rather a genuine liquidation phase.
To clarify, the ADX is indicating that we’ve transitioned from range-bound conditions to a proper trending state – unfortunately for bulls, that trend points decisively lower. Therefore, day traders should adapt their strategies to this reality: fade any rallies into resistance rather than trying to catch bottoms prematurely. The ADX would need to drop back below 25 while price stabilizes to signal the selling pressure is finally exhausting itself.
Price Trapped Below Entire EMA Ribbon Since Breaking $0.52 Support
Looking at the moving average structure reveals just how comprehensively the bulls have lost control. ADA trades well below the 10-day ($0.443), 20-day ($0.484), and crucially, the 50-day EMA at $0.578 – creating a bearish sandwich that’s capped every relief attempt since mid-December. Even the temporary network split that Cardano quickly resolved couldn’t push price above the nearest resistance at the 10-day EMA, demonstrating how technical sellers emerge at every opportunity. More telling is the compression between the 20-day and 50-day EMAs, which threatens to produce a death cross in coming sessions. The 200-day EMA sits far overhead at $0.592, now serving as a distant target rather than nearby support. That former support area at $0.52 – which held multiple times through November – now transforms into a red line that bulls must reclaim to even begin discussing trend reversal. Until then, every EMA acts as dynamic resistance, making sustained rallies nearly impossible.
$0.388 Monthly Low Becomes Final Defense Before 2023 Lows Test
The immediate resistance stacks between $0.443 (10-day EMA) and $0.484 (20-day EMA), with December’s breakdown point at $0.52 looming as major resistance if bulls somehow manage initial hurdles. Above that, the psychological $0.60 level aligns with the 200-day EMA, creating a formidable barrier. Sellers defended the $0.45 zone aggressively during this week’s feeble bounce attempt, confirming that overhead supply remains abundant despite oversold conditions.
Support architecture looks dangerously thin after the cascade through multiple floors. The $0.417 current price hovers just above the monthly low at $0.388, which represents the last technical support before ADA risks testing 2023’s bear market lows near $0.35. What’s particularly concerning is how the AI sector turmoil news accelerated the breakdown through support – suggesting that any negative catalyst could trigger another leg lower. The weekly pivot at $0.405 offers minor support, but it lacks the historical significance to halt a determined selloff.
Crucially, the market structure signals complete bearish control as long as price remains below $0.52. The fact that positive fundamental news including global listing expansions and native token launches couldn’t spark even a relief rally to test the 10-day EMA reveals how deeply negative sentiment has become. This setup resembles March 2023’s capitulation phase, where ADA needed multiple weeks of base-building before attempting any meaningful recovery.
Bulls Require Decisive Close Above $0.52 to Signal Potential Bottom
Bulls need a daily close above $0.52 to even begin discussing trend reversal – that level represents both the December breakdown point and the convergence of multiple moving averages. Should ADA reclaim and hold above this zone, the next targets would be $0.578 (50-day EMA) and eventually $0.60 psychological resistance. The upcoming key December dates mentioned in recent news could provide the catalyst, but technical evidence must confirm any fundamental narrative.
The bearish scenario triggers if ADA loses the $0.388 monthly low on volume – this would likely flush positions down to the $0.35 area where 2023 support waits. A sustained break below $0.35 would trap recent bottom-fishers and potentially accelerate declines toward $0.30. Given that the network split news didn’t cause additional selling, it seems only a broader crypto market washout would trigger this scenario.
With current momentum deeply oversold but trend structure remaining bearish, the most probable near-term path sees ADA attempting a relief bounce toward $0.45-0.48 before sellers re-emerge. This consolidation between $0.388-0.48 would allow oversold indicators to reset while the market digests whether December’s fundamental developments can shift sentiment. Only sustained trading above $0.52 would signal that a meaningful bottom has formed.