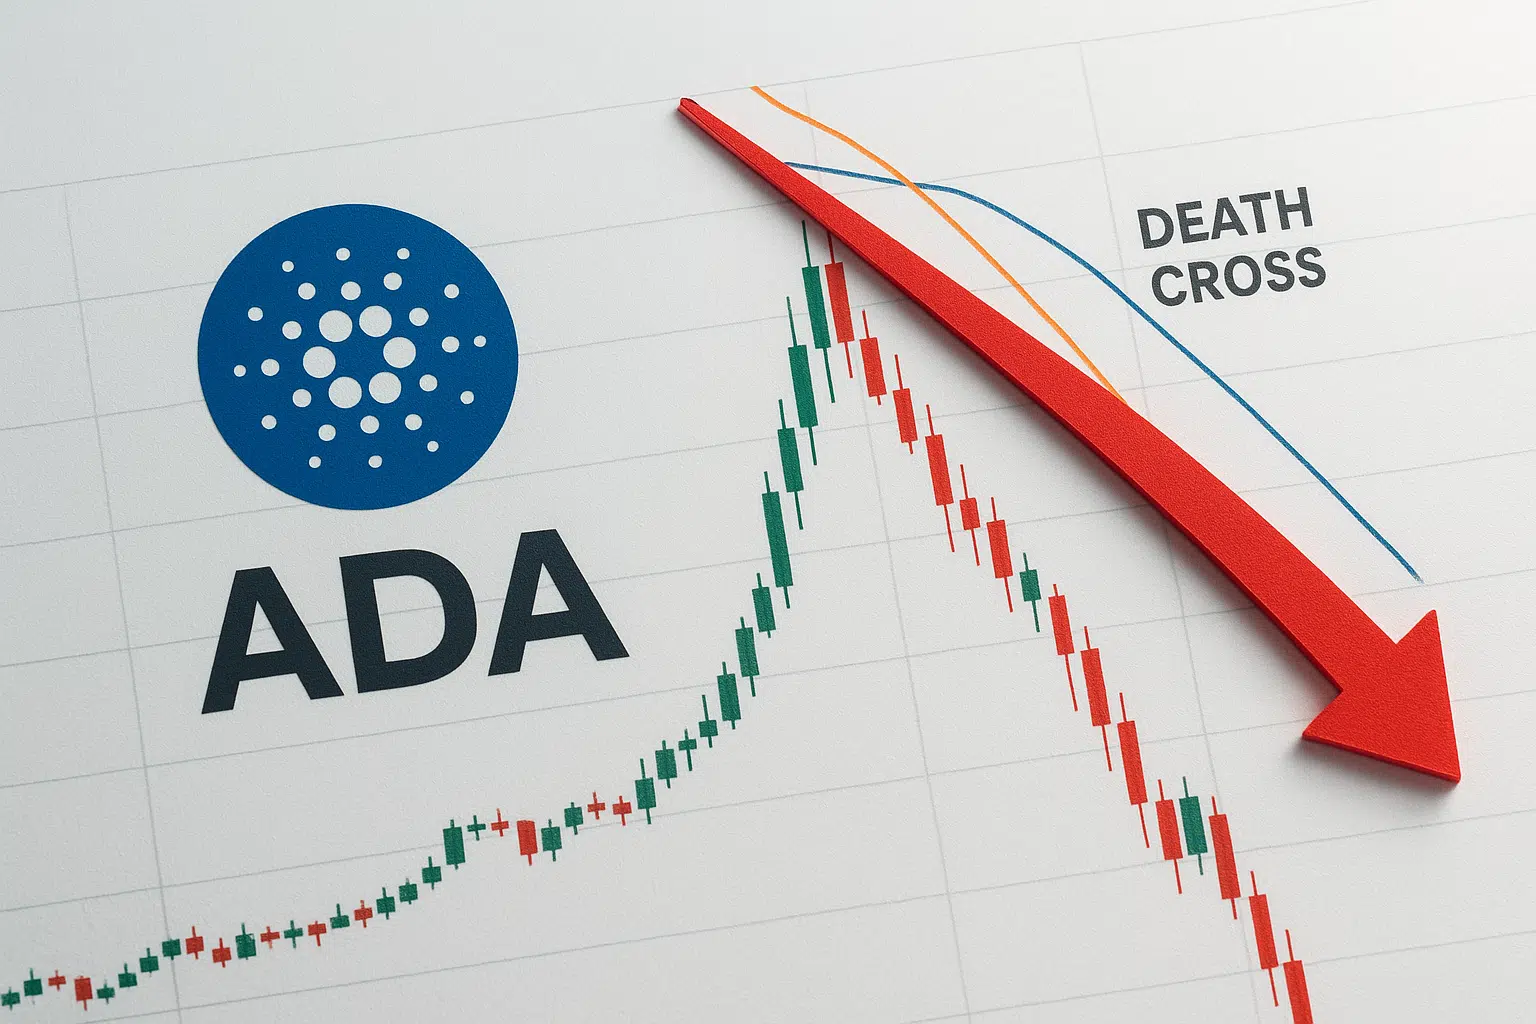
Cardano Plunges 25% in Seven Days as Death Cross Looms Over ADA Price Structure
Market Structure Shifts Lower
- Cardano (ADA) has been significantly impacted by the recent sell-off in the cryptocurrency market, tumbling from $0.73 to a low of $0.546 and currently hovering around $0.60.
- With the death cross formation looming on the horizon, losses could worsen and panic selling may intensify.
- The price action in the next couple of weeks could be crucial.
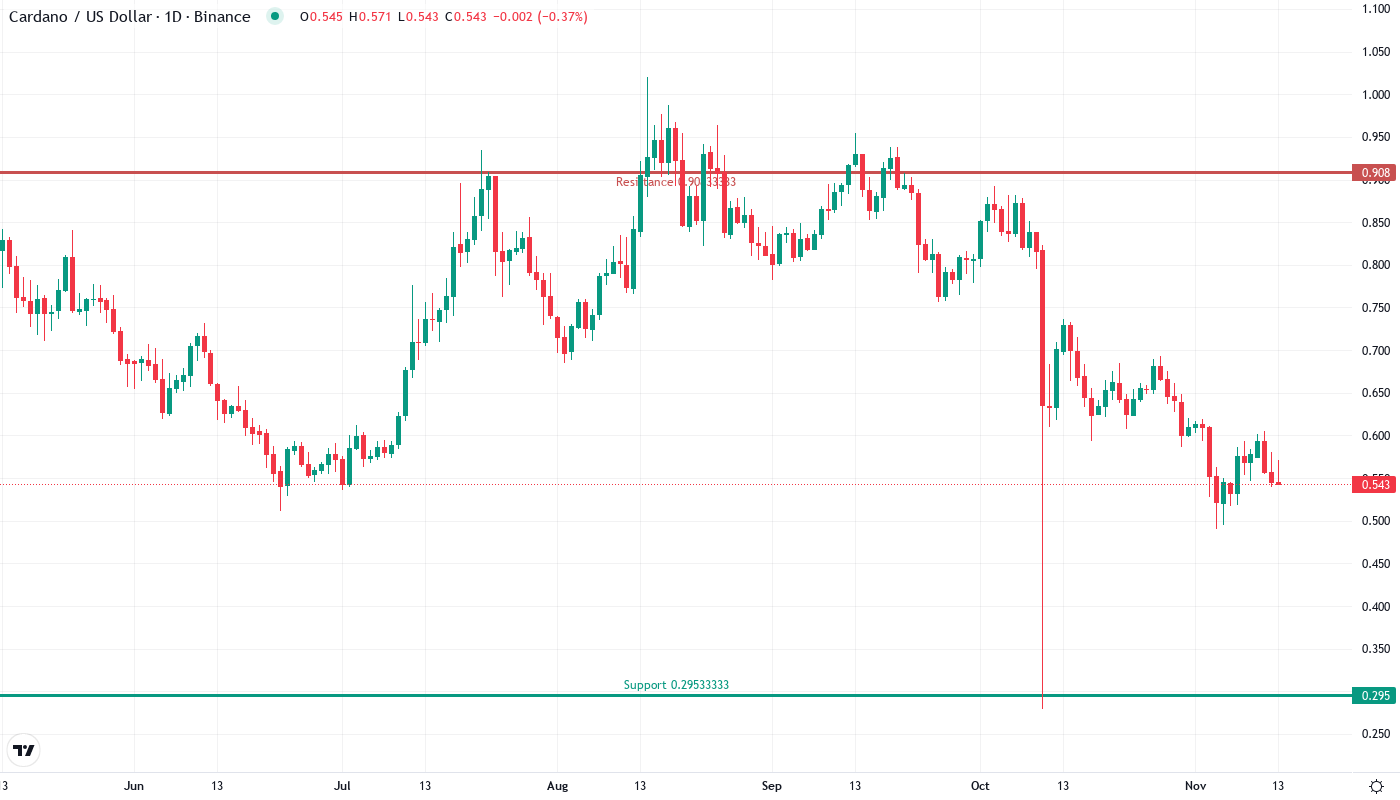
The weekly stochastic oscillator aims for the oversold zone, predicting lower prices in the next two to four weeks. This adds credibility to the idea that the March 2020 breakout gap between $0.20 and $0.17 will eventually get tested, even if the decline temporarily stalls now. As more aggressive sellers enter the market near the 50-week exponential moving average (EMA) at $0.56, the downside seems stacked in the short term, especially if market sentiment continues to weaken. Both levels are profit points for shorts but may not generate oversold conditions given the momentum of the deteriorating technical outlook.
| Metric | Value |
|---|---|
| Asset | CARDANO (ADA) |
| Current Price | $0.55 |
| Weekly Performance | 0.37% |
| Monthly Performance | -25.21% |
| RSI (Relative Strength Index) | 37.8 |
| ADX (Average Directional Index) | 46.3 |
| MACD (MACD Level) | -0.04 |
| CCI (Commodity Channel Index, 20-period) | -65.77 |
RSI Resets to 37.76 – First Sub-40 Reading Since November Capitulation
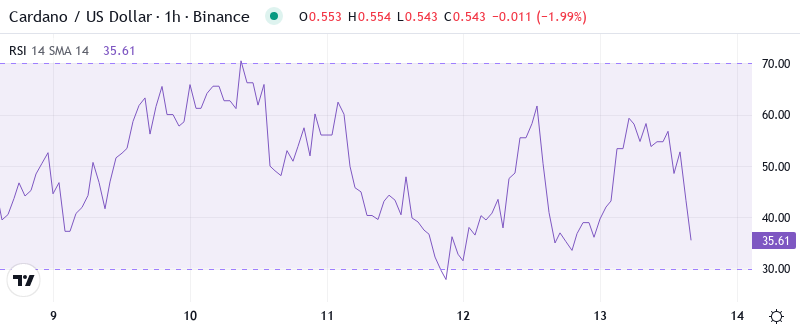
The Relative Strength Index prints at 37.76 on the daily scale, which serves as the initial sub-40 reading since the “rinse” in November that sparked a 45% bounce. This reset brings some relief from the overbought readings that rendered ADA susceptible to the pullback from the $0.70 level and puts the coin back into potential accumulation range as the oscillator exits oversold territory.
What is interesting to note is the behavior of RSI during the decline, as instead of collapsing to extremely oversold conditions below 30, the indicator held above the November low. This indicates that for swing traders, a more controlled selloff without panic-ridden extremes implies that sellers are not rushing for the exits on the death cross news which could lead to a more stabilizing process if $0.50 proves to be supportive.
ADX at 46.30 Signals Mature Downtrend Nearing Exhaustion Point
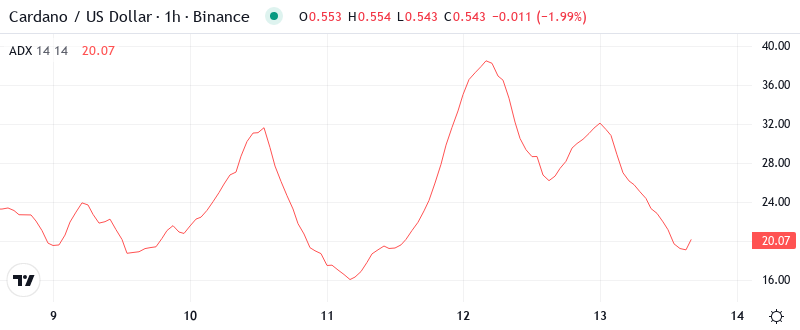
An ADX reading between 0 and 25 is generally seen as indicating a sideways or weak trend, and a reading from 25 to 50 is considered strong. A reading of 50 to 75 reflects a very strong trend, and a reading between 75 and 100 is extremely strong.
If we look at the chart, recent ADX spikes to these levels have been followed by heavy reversal candles or contracting candles post uptick before a more substantial reversal, meaning intra-week shorts are viable here for aggressive shorts. Long-term buyers and DCA investors are best served continuing to wait, staying patient to add around the .20-25 zone with DCA offers. Transport → Housing → Elevator = Trend = Volatility Indices have been your best indicators.
50-Day EMA at $0.619 Looms as Next Resistance After Support Breakdown
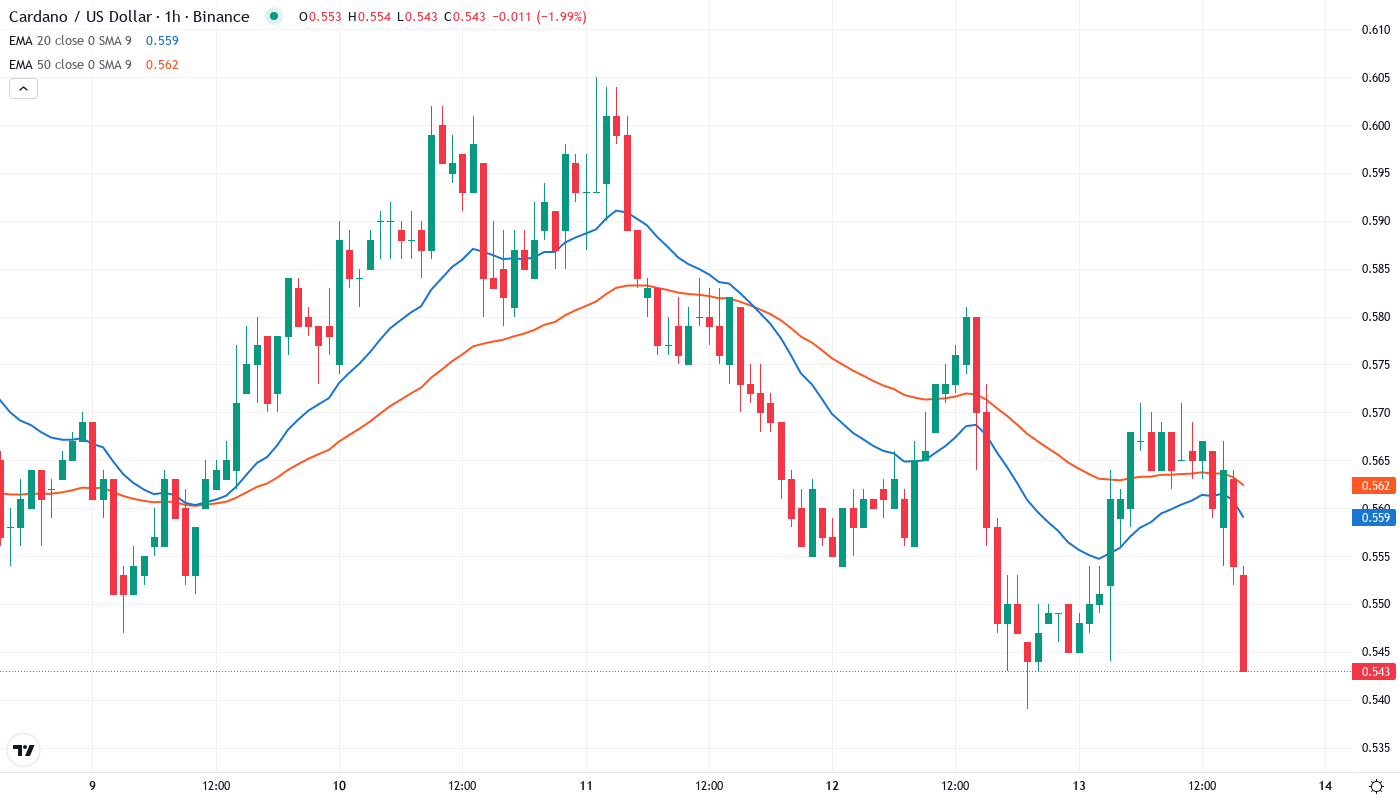
If the price consolidates or gathers steam over the next few days, ADA will face stiff resistance at the 20-EMA (~$0.576) on the 4-hour, as well as the hourly 50-bar EMA ($0.582), which would also coincide with a retest of the 10-day EMA.
What is perhaps more alarming for bulls is the fact this death cross presentation was the main reason for profit-taking in early November. Prior to that event, the XLM price action was in a transition phase between a bullish accumulation zone below $0.360 and bullish expansion phase once the XLM broke above $0.728.
Death Cross Threat Meets $0.50 Support in High-Stakes Showdown
There is strong resistance in the $0.590 to $0.657 range, which is the confluence of the 20-day EMA and December’s breakdown level. The recent overhead supply area is where long positions from the unsuccessful relief rally are stuck, which acts as a resistance level on any bounce back.
Buyers continue to struggle in the quest of the elusive $0.618 level and face a heavyweight challenge given the numerous week-long rejections in November. Former support turned resistance at the 0..618 level presents an obvious target and point for dominance if prices overcome the previous price ceiling. A break above $0.618 would attract range buyers and sellers, creating space for a quick, perhaps runaway, move towards $0.75 – the secondary level.
The current setup is akin to a spring being compressed by death cross dynamics from above and solid support from below. The recent launch of the Wirex card, which allows ADA to be spent in 130 countries, furnishes fundamental support that can protect these technical levels – but only if adoption metrics push the spring back up fast enough to counterbalance algorithmic sales.
Bulls Require Decisive Close Above $0.590 to Neutralize Death Cross Pressure
If the price of XRP can rise above the 20-day EMA at $0.590 and stay there convincingly, it is likely to attract further buying and the relief rally could extend to the 50-day EMA at $0.619. The expanding payment card ecosystem could keep the uptrend intact. A death cross on the moving averages could be avoided if the bulls can push the price above $0.619 and sustain it for three days.
If the support at $0.50 is broken with high volume, then it would expose the XRP/USD pair to the next lower level at $0.45. A breakdown from $0.50 to $0.45 could result in panic selling that may drag the price down to $0.40. The next support on the downside is $0.22.
It is likely that ADA will consolidate between the $0.50-$0.59 range in the immediate term since this level is oversold based on the 37.76 RSI and this straight upward trajectory market appears poised to read more on the consolidation pattern here. Given the death cross threat, ADA had established a lower range of support between the $0.45-$0.47 level while technically setting up a lower high to fuel further depreciation.