BNB Tumbles 25% From December Peak as ETF Optimism Meets Technical Resistance
Market Structure Shifts Lower
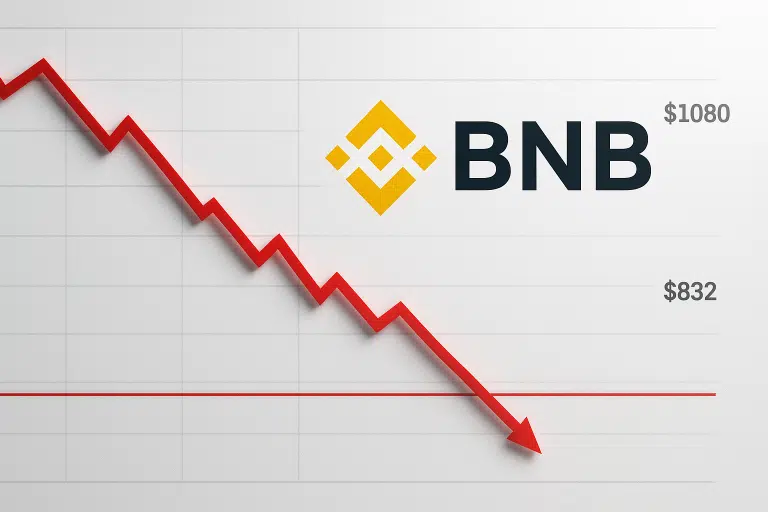
- BNB devastated by 25% monthly drop from $1,095 to current $816 levels
- VanEck ETF application buzz unable to prevent technical breakdown at crucial $900 support
- RSI reset to neutral territory after overbought extremes – room for recovery emerges
Binance Coin has been clobbered over the past month, shedding 25.07% from its December high of $1,095 to hover around $816. The devastating drop kicked in after price decisively rejected at the psychological $1,000 level – precisely where VanEck’s ETF application had bulls targeting. What started as institutional optimism transformed into a liquidity hunt that trapped late buyers above $950. The main question for traders is: can BNB defend the $800 floor where multiple support confluences meet, or will the ETF narrative lose steam entirely?
| Metric | Value |
|---|---|
| Asset | BNB (BNB) |
| Current Price | $816.10 |
| Weekly Performance | -3.20% |
| Monthly Performance | -25.07% |
| RSI (Relative Strength Index) | 31.7 |
| ADX (Average Directional Index) | 35.2 |
| MACD (MACD Level) | -38.54 |
| CCI (Commodity Channel Index, 20-period) | -114.43 |
Momentum Resets to 44.35 After December’s Overbought Spike
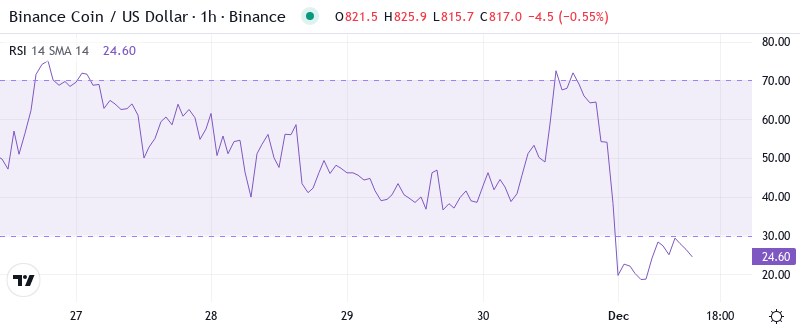
RSI sits at 44.35 on the daily timeframe, marking a complete reset from the overbought readings above 70 that accompanied December’s surge past $1,000. This neutral oscillator position signals neither bulls nor bears control momentum – essentially wiping the slate clean for directional trades. The weekly RSI tells a more constructive story at 50.05, holding exactly at the midpoint that has acted as a springboard in previous cycles.
Looking back at similar RSI configurations, September’s dip to 45 preceded a 35% rally once buyers emerged. The current setup mirrors that period closely, with one key difference – this time institutional players have skin in the game through the VanEck filing. So for swing traders, this balanced RSI means patience pays while waiting for momentum to pick a direction, but the risk-reward increasingly favors accumulation near these oversold daily readings.
ADX at 35.17 Confirms Mature Downtrend Losing Steam
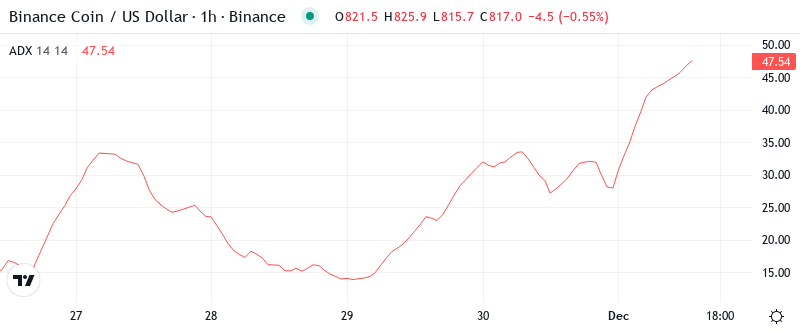
Trend strength measured by ADX reads 35.17, indicating the month-long selloff carried real conviction but now approaches exhaustion territory. The elevated reading confirms sellers dominated with force – this wasn’t mere profit-taking but a genuine trend reversal from December highs. Historically, ADX readings above 35 during BNB corrections mark capitulation phases rather than the start of deeper bearish cycles.
To clarify, the ADX is indicating we’re transitioning from trending conditions back toward consolidation. When ADX peaks above 35 and starts rolling over, as it appears to be doing now, range-bound price action typically follows for several weeks. Therefore, day traders should adjust strategies from trend-following to mean reversion, targeting moves between established support and resistance rather than betting on continuation.
$880 EMA Confluence Creates Make-or-Break Defense Zone
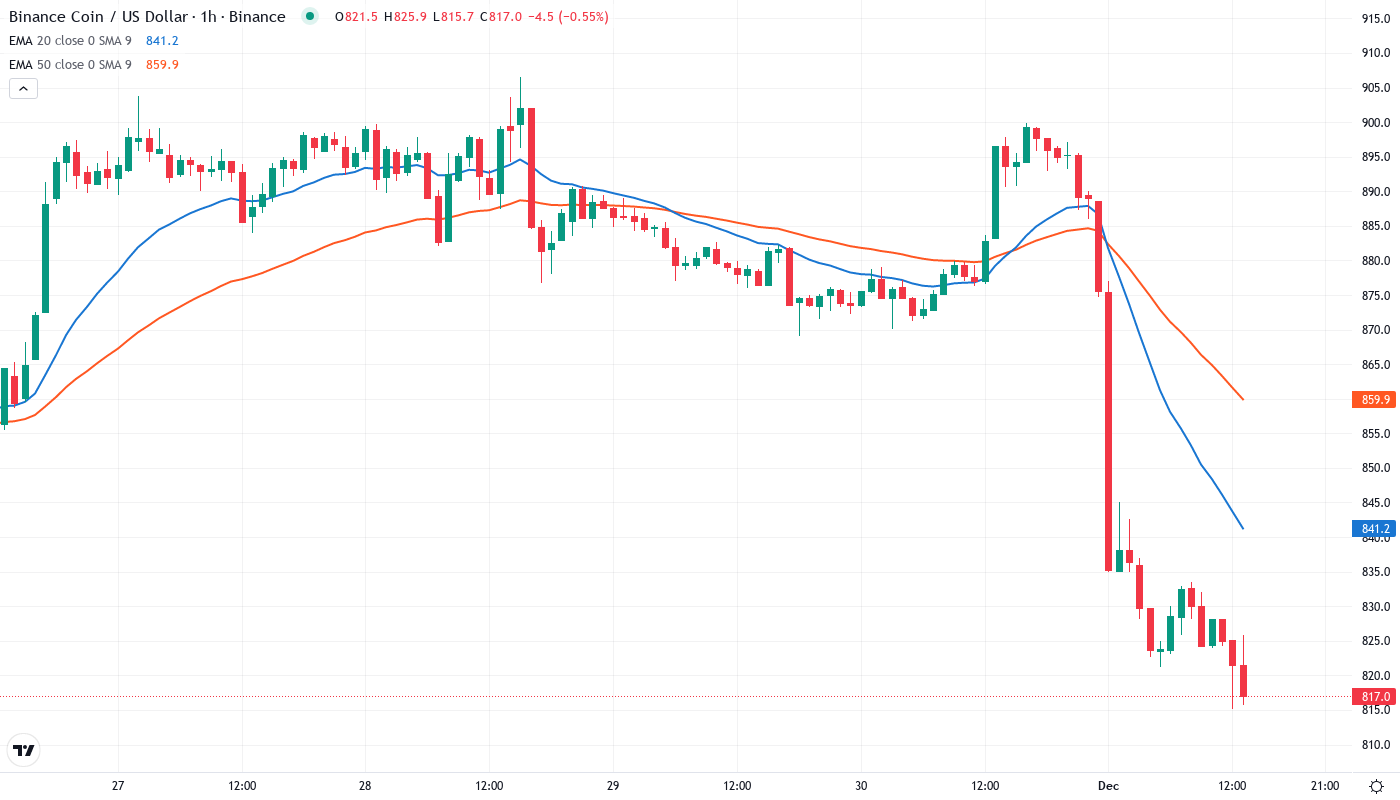
Price action reveals a critical battle unfolding at the EMA ribbon between $860-$880. BNB currently trades at $816, sitting below the 10-day ($869), 20-day ($895), and 50-day ($954) EMAs – but crucially holding above the 100-day at $880. This compression of moving averages creates a formidable resistance ceiling that rejected recovery attempts three times in the past week.
What’s particularly revealing is how the 50-day EMA at $954 transformed from support to resistance after the ETF-fueled rally failed. That level now caps any relief bounce attempts, while the 100-day EMA at $880 stands as the final defense before opening an air pocket toward the 200-day at $531. Bulls need to reclaim at least the 20-day EMA at $895 to shift near-term structure bullish – otherwise, the entire EMA stack remains bearish pressure overhead.
Triple Resistance Stack at $900-$950 Gates Recovery
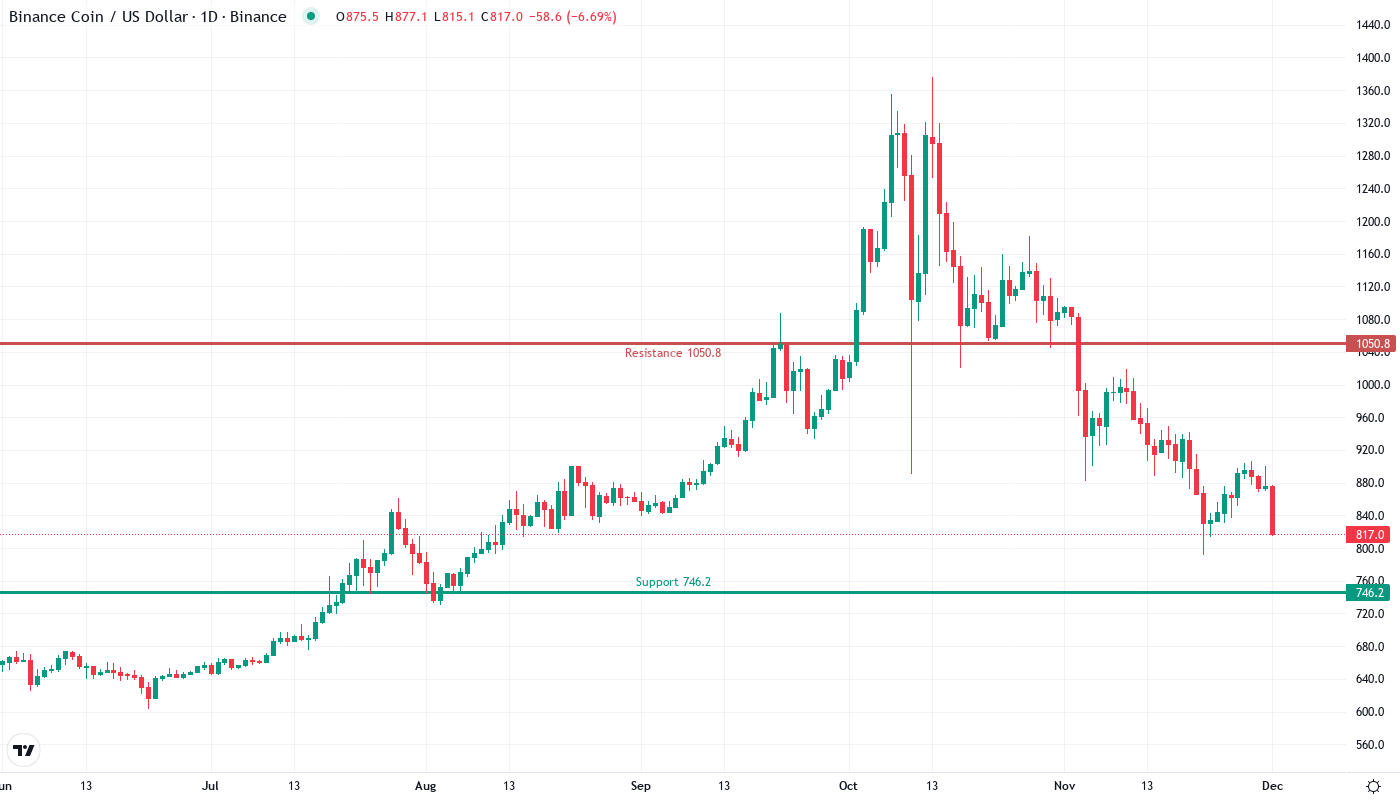
Resistance clusters between $900 and $950 where December’s broken support meets the monthly pivot at $906. This zone rejected advances four times since the initial breakdown, with each attempt showing progressively weaker volume. The psychological $1,000 level looms as the ultimate target for bulls, but they must first prove strength by reclaiming the $900-$950 battleground where trapped longs await exits.
Bulls defend multiple support layers below current price, with the most immediate at $799 where the weekly S1 pivot aligns with horizontal structure. The Korean stablecoin regulatory progress adds fundamental backing to this technical floor, as improving Asian market sentiment historically benefits BNB flows. Below that, $746 marks the monthly S1 pivot and previous accumulation zone from November.
Market structure signals a potential bottoming process as long as $800 holds on any retest. The measured move from December’s high targets $690 if support fails, but the confluence of technical levels and improving regulatory backdrop suggests buyers emerge before testing those depths. This configuration resembles the September 2023 consolidation that preceded October’s explosive rally – patient accumulation followed by violent upside.
ETF Catalyst Requires Reclaim Above $900 for Credibility
Bulls must secure a daily close above $900 to reignite the VanEck ETF narrative and flip market structure bullish. Such a move would reclaim the 20-day EMA and monthly pivot simultaneously, likely triggering stop-loss covering that could quickly extend toward $950. The institutional interest story remains intact but needs price confirmation to attract fresh capital.
The bearish scenario triggers if BNB loses $800 support on volume, opening a direct path toward the 100-day EMA at $880 initially, then potentially the $746 monthly S1. This would trap recent ETF speculation buyers underwater and likely spark capitulation toward $690 – completing a 37% correction from December highs that matches historical drawdown patterns.
Given current momentum reset and support confluence at $800, the highest probability path sees BNB consolidating between $800-$900 while the market digests the ETF filing implications. Range traders can work these boundaries while position traders await a decisive break of the range – with institutional developments and Asian regulatory progress serving as potential catalysts in either direction over the coming weeks.