BNB Tumbles 25% as Whale Dumps $10.7M Worth – Support Tests at $812

Market Structure Shifts Lower
- BNB plunged 25.4% from monthly highs after a major whale liquidated $10.7 million worth
- Key support at $812 faces its first serious test since the November rally
- ADX climbs past 35, confirming sellers have taken directional control
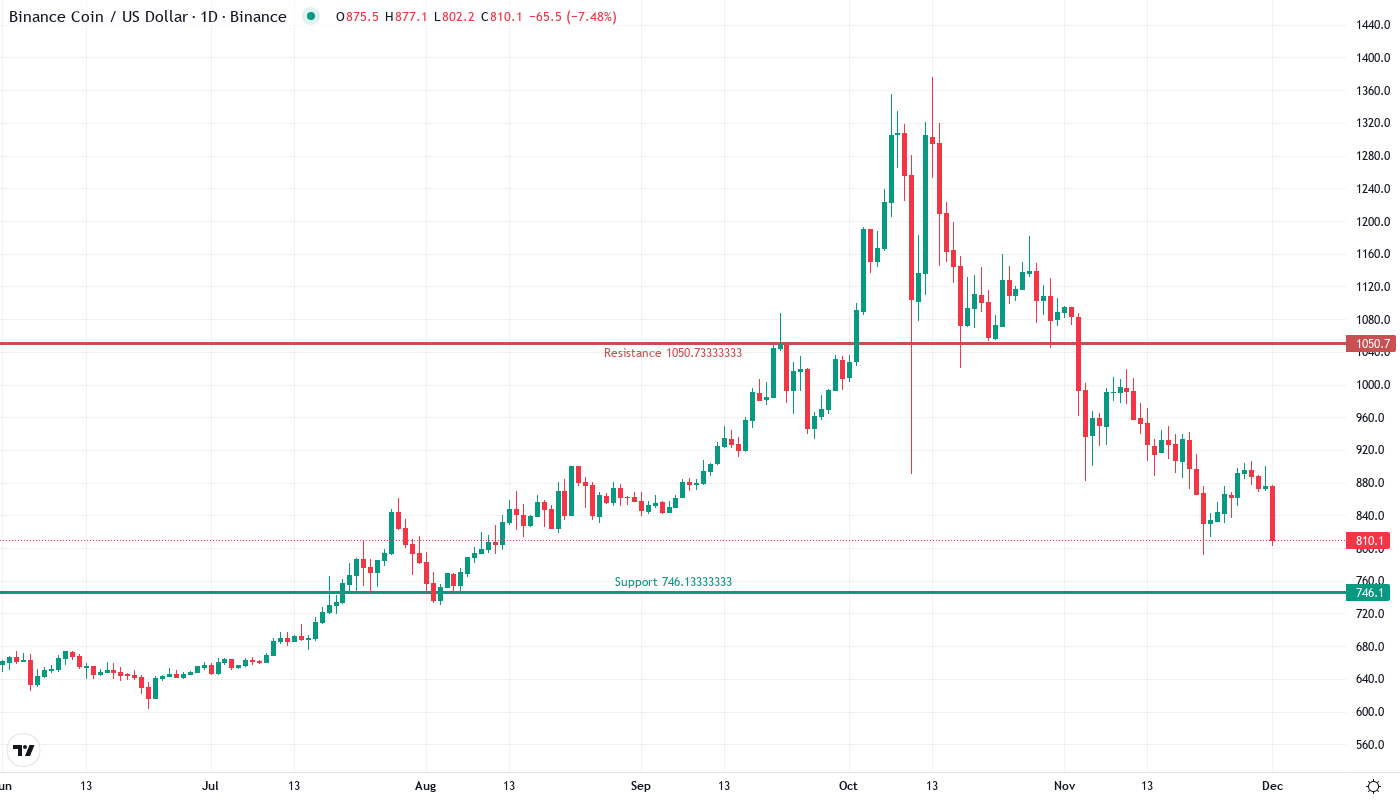
BNB has taken the elevator down this month, sliding from $1,095 to current levels around $812 – a devastating 25.4% drop that erased roughly $283 in value per coin. The collapse accelerated after news broke of a whale dumping $10.7 million worth of BNB, triggering stop-loss cascades below multiple support levels that had held firm since November. The main question for traders is: will the psychological $800 level hold, or are we headed for a deeper flush toward $700?
| Metric | Value |
|---|---|
| Asset | BNB (BNB) |
| Current Price | $812.30 |
| Weekly Performance | -3.65% |
| Monthly Performance | -25.42% |
| RSI (Relative Strength Index) | 31.3 |
| ADX (Average Directional Index) | 35.3 |
| MACD (MACD Level) | -38.87 |
| CCI (Commodity Channel Index, 20-period) | -124.92 |
Momentum Exhaustion Signals Capitulation Phase Near Completion
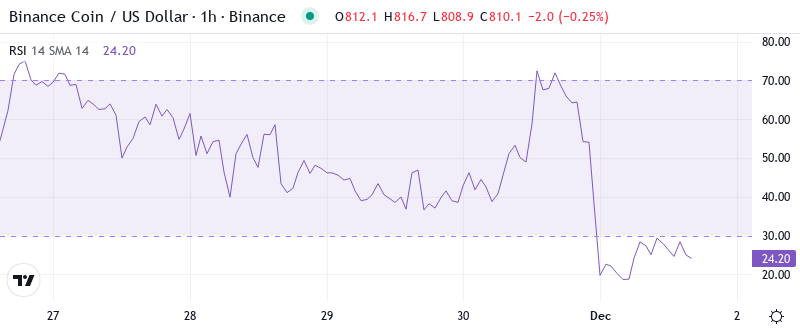
Reading the oscillator at 31.31, traders see momentum reaching oversold territory for the first time since the August washout that preceded a 40% recovery rally. The RSI on the daily timeframe hasn’t touched these depressed levels in nearly five months, suggesting the selling pressure from the whale liquidation and subsequent panic may be approaching exhaustion. What’s particularly revealing is how quickly momentum collapsed – from neutral readings above 50 just two weeks ago to today’s oversold condition, matching the velocity of decline seen during major market corrections.
So for swing traders, this oversold RSI configuration presents a classic mean-reversion setup, though catching falling knives requires precise timing and strict risk management. Historical data shows BNB typically bounces within 3-5 days of hitting RSI readings below 35, but given the magnitude of the whale dump and ongoing regulatory concerns from the Europol cryptomixer raids, any relief rally might face immediate selling pressure. The combination of technical oversold conditions with fundamental headwinds creates a high-risk, high-reward scenario where patient traders might find opportunity, but only if support at $812 proves resilient.
ADX at 35.33 Confirms Mature Downtrend – Range Traders Step Aside
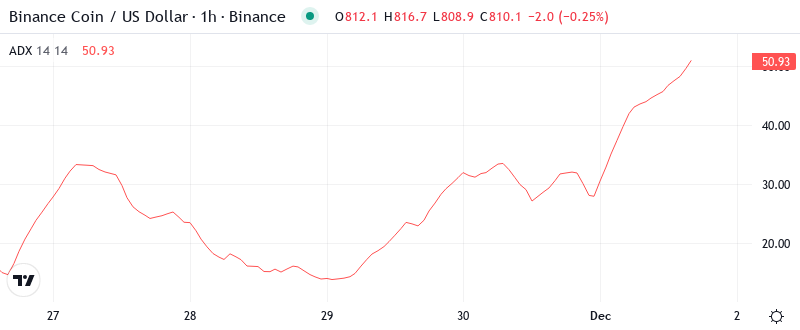
Trend strength has exploded higher with ADX climbing to 35.33, marking the strongest directional movement since early 2024. At this level, the ADX entry indicates we’re well past the initial breakdown phase and into a confirmed trending environment where sellers maintain firm control. Basically, when ADX pushes above 30, it signals that the market has picked a direction and momentum traders should align their strategies accordingly – in this case, the direction is decisively lower following the whale liquidation catalyst.
To clarify, the shift from December’s choppy consolidation (when ADX lingered below 20) to today’s trending conditions happened rapidly once the $10.7 million sell order hit the market. This isn’t just a minor pullback within a range; it’s a genuine trend move that typically continues until ADX peaks and begins declining. Therefore, day traders should abandon range-bound strategies and instead focus on shorting rallies toward resistance or waiting for ADX to roll over above 40 – historically the exhaustion zone where trends lose steam and reversals become more probable.
20-Day EMA at $894 Becomes First Major Resistance After Support Failure
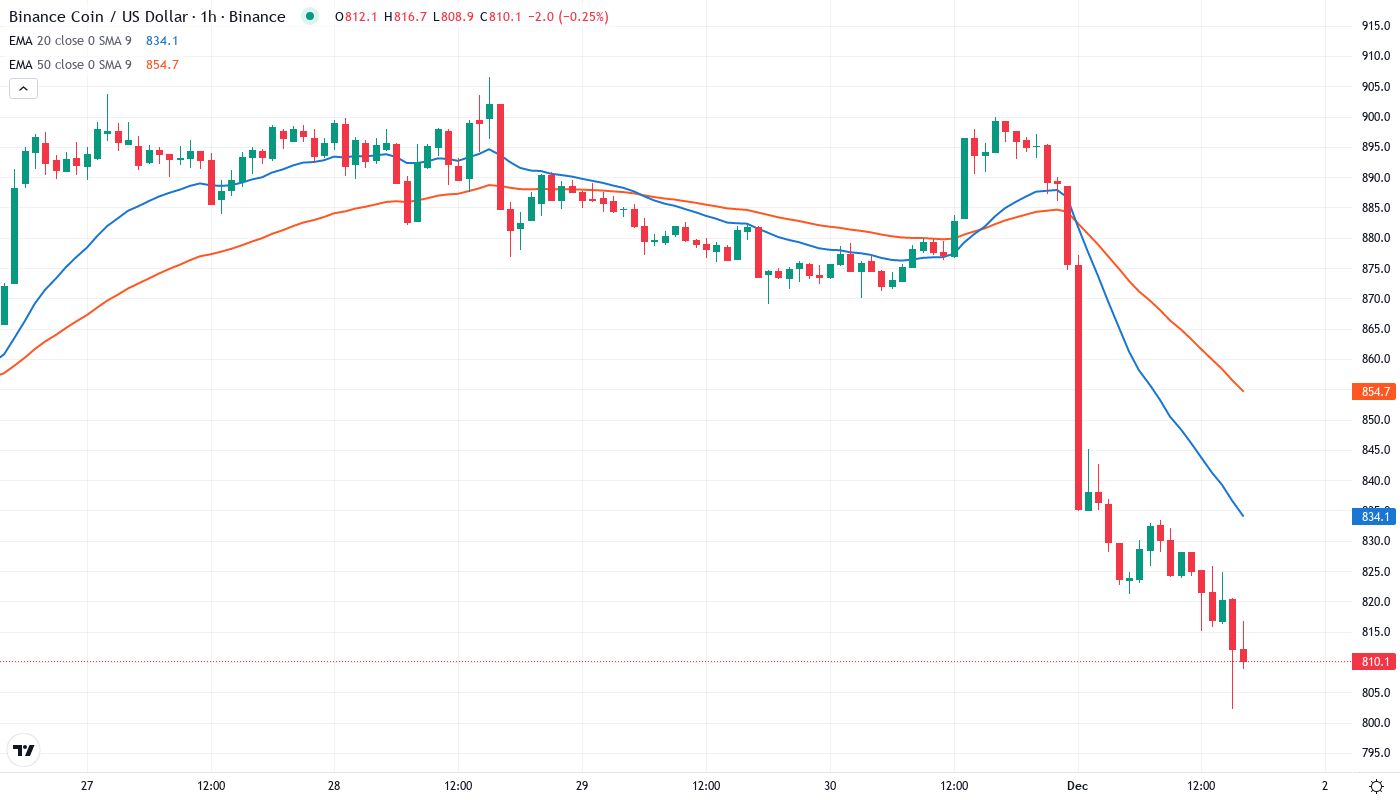
Price action tells a clear story through the EMA structure. BNB currently trades well below the entire moving average ribbon, with the nearest resistance sitting at the 10-day EMA ($868), followed by the more significant 20-day ($894) and 50-day ($953) levels. The 20-day EMA, which provided reliable support throughout November and early December, flipped to resistance after price crashed through it on heavy volume during the whale dump. This level now represents the first major hurdle for any recovery attempt.
Most significant is the compression between the 50-day ($953) and 100-day ($950) EMAs, creating a formidable resistance cluster around the $950 zone. Bulls attempting to reclaim the uptrend would need to push price back above this entire cluster – a task made more difficult by the negative sentiment from both the whale liquidation and regulatory concerns. The 200-day EMA sits much higher at $1,530, so distant it’s currently irrelevant for short-term traders. For now, the immediate battle lines are drawn: bears defend the 20-day at $894 while bulls need to hold the line at current support around $812.
Resistance Stacks Heavy Between $900 and $950 as Former Support Flips
Above current price, sellers have fortified multiple resistance zones that coincide with both technical levels and psychological barriers. The immediate ceiling sits at the daily pivot point of $906, closely followed by the 20-day EMA at $894 and the round number at $900. This $894-906 zone represents the first major test for any bounce attempt, as it combines dynamic resistance from the moving average with static resistance from the pivot structure. The whale dump created a supply overhang in this region as trapped longs who bought the initial dip likely wait to exit at breakeven.
Bulls defend the current support at $812, which aligns perfectly with both the weekly low and the psychological level where buyers have emerged three times over the past week. Below this, the next meaningful support doesn’t appear until the monthly S1 pivot at $746, creating an air pocket of roughly $66 where stop-losses could trigger another cascade. The December low at $792 offers minor support, but it lacks the confluence factors that make $812 more significant.
The market structure reveals a clear shift in control from buyers to sellers. As long as price remains below the $894-906 resistance zone, the path of least resistance points lower. The whale liquidation essentially reset the entire technical picture, transforming what was a healthy consolidation above moving averages into a confirmed downtrend where former support levels now act as resistance. This structural damage typically takes time to repair, suggesting any immediate bounce might struggle to gain traction without a positive catalyst to offset the negative sentiment.
Bears Dominate Until Close Above $894 Restores Bullish Structure
Bulls require a decisive daily close above the 20-day EMA at $894 to signal the selling pressure from the whale dump has exhausted. Such a reclaim would flip the first major resistance back to support and open the path toward testing the $950 cluster where the 50 and 100-day EMAs converge. The ongoing developments in Asian markets, particularly Korea’s stablecoin regulations, could provide the positive catalyst needed for this recovery if they enhance overall market confidence.
The bearish scenario triggers if $812 support fails on volume, which would confirm the whale liquidation marked just the beginning of a larger distribution phase. Loss of this level targets the monthly S1 at $746, with potential for an accelerated flush toward $700 if panic selling emerges. The Europol raid on cryptomixers adds regulatory overhang that could cap any rallies, making the bearish path more probable if negative news flow continues.
Given the technical damage from the 25% monthly decline and the fundamental headwinds from both whale selling and regulatory concerns, the most likely near-term path sees BNB consolidating between $792-894 as the market digests the recent volatility. This sideways grind would allow moving averages to descend toward price, setting up a cleaner technical picture for the next directional move once ADX peaks and begins declining from current extreme readings.