BNB Tests Critical Support at $832 After Month-Long Bleed From $1,080
Market Pulse
- BNB shed 27% from December’s $1,080 perch, erasing three months of gains
- ADX climbs past 37, confirming sellers control the trend with conviction
- Bulls defend the psychological $800 level after six attempts since October
BNB’s price action tells a sobering story as the token tumbles from $1,080 to $832 in just four weeks, marking a devastating 22.3% monthly decline that wiped out the entire Q4 rally. The collapse accelerated after the critical $1,080 support shattered amid rising derivatives volatility, triggering stop-loss cascades that pushed price through multiple support zones without meaningful bounces. The main question for traders is: can bulls defend the psychological $800 level that held firm during October’s washout, or will this support finally crack under sustained selling pressure?
| Metric | Value |
|---|---|
| Asset | BNB (BNB) |
| Current Price | $832.60 |
| Weekly Performance | -9.05% |
| Monthly Performance | -22.30% |
| RSI (Relative Strength Index) | 28.9 |
| ADX (Average Directional Index) | 37.1 |
| MACD (MACD Level) | -54.45 |
| CCI (Commodity Channel Index, 20-period) | -187.80 |
RSI at 28.92 Signals Deep Oversold Territory – Matches October’s Capitulation Low
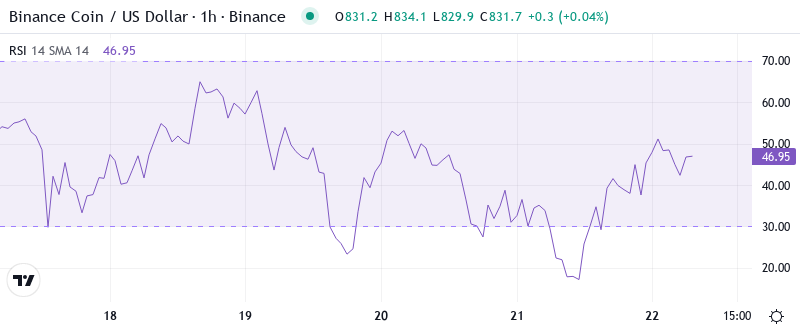
RSI sits at 28.92 on the daily timeframe, plunging into oversold depths not witnessed since October’s market-wide capitulation. What’s revealing is how rapidly momentum collapsed – from a neutral 56 reading just two weeks ago to today’s extreme, suggesting panic selling rather than orderly distribution. Similar RSI configurations in October preceded a 40% relief rally once the selling exhausted itself, though that bounce required multiple days of consolidation below 30 to build a sustainable floor.
So for swing traders, this deeply oversold reading creates a high-probability bounce setup, but patience remains crucial. The weekly RSI at 46.27 shows room for further downside on higher timeframes, meaning any daily oversold bounce could face resistance near $900-920 where the 20-day EMA now sits. Smart money typically waits for RSI to climb back above 30 with price holding support before committing to reversal trades.
ADX at 37.09 Confirms Mature Downtrend Gaining Steam
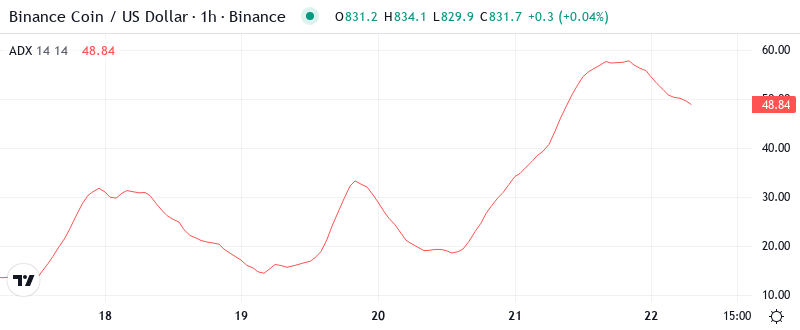
Looking at trend strength, the ADX rocketed from 18 to 37.09 in just three weeks, signaling the shift from November’s choppy consolidation to December’s directional collapse. At the level of 37.09, the ADX entry indicates that the downtrend carries serious conviction – this isn’t a fake breakdown but rather institutional distribution with follow-through. Basically, readings above 35 warn that fighting the trend becomes increasingly dangerous as momentum builds behind the dominant direction.
Therefore, day traders should adapt strategies to this trending environment by selling rallies rather than buying dips until ADX drops back below 25. The derivatives volatility surge mentioned in recent market structure reports aligns perfectly with this ADX spike, as leveraged positions unwinding often accelerate trends beyond normal boundaries. Only when ADX starts declining from these elevated levels will the selling pressure likely exhaust itself.
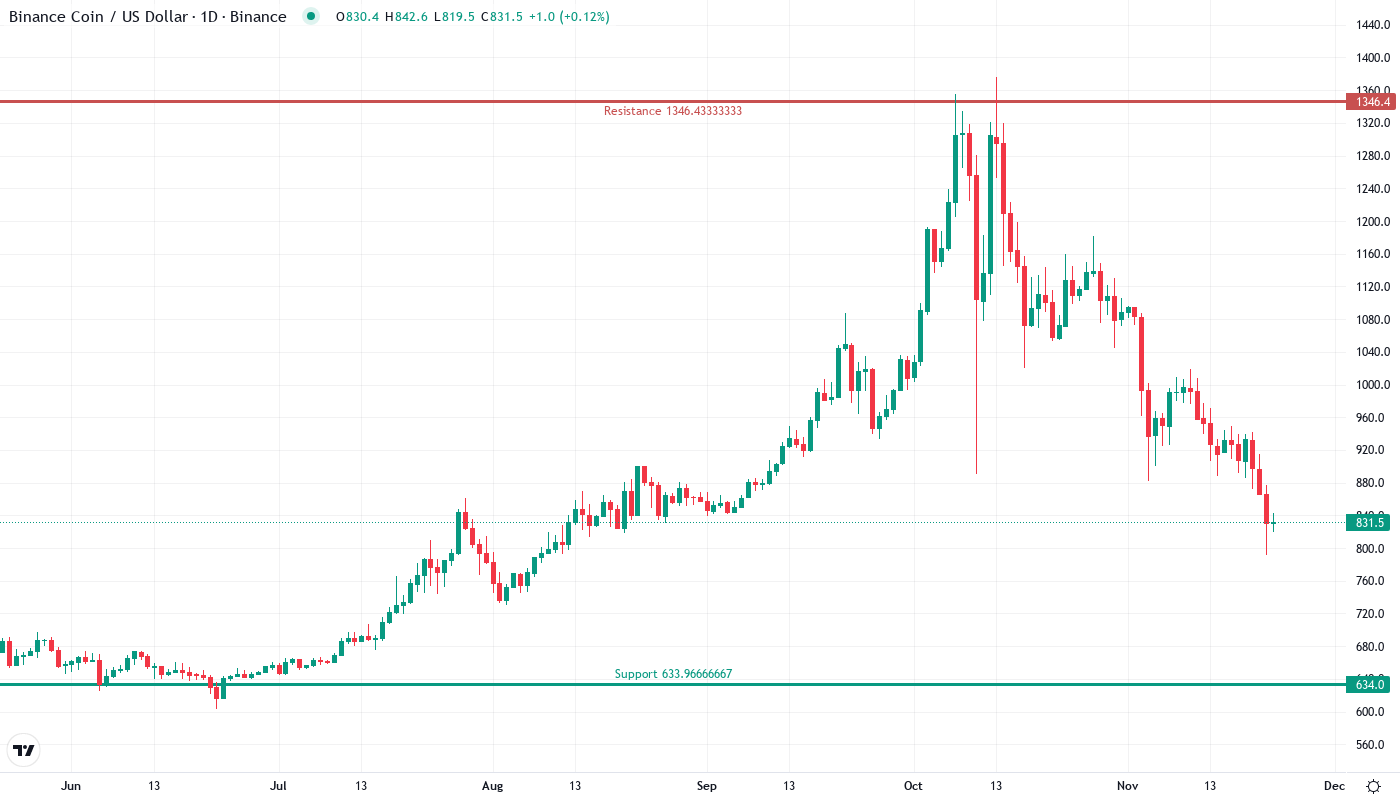
20-Day EMA at $937 Transforms From Support to Resistance Ceiling
Price action through the EMA ribbons paints a grim picture for bulls. BNB trades decisively below all major moving averages – the 10-day ($892), 20-day ($937), and critically, the 50-day EMA at $967. What’s particularly damaging is how the 20-day EMA flipped from reliable support throughout November’s rally to stubborn resistance, rejecting two relief attempts in the past week. This level changed from being a launchpad for buyers to a trap door for trapped longs.
The broader trend structure shows even more concern with price sitting 16% below the 200-day EMA at $991. Bulls desperately need to reclaim the 50-day EMA at $967 to shift medium-term structure positive, but that requires conquering multiple resistance layers stacked between current levels and $1,000. That former support cluster from $937-967 now transforms into a formidable resistance zone that likely caps any near-term recovery attempts.
Resistance Wall Builds From $900 to Former Support at $1,080
Above current price, sellers have fortified a multi-layered defense zone stretching from the psychological $900 level through the monthly pivot at $906. The immediate resistance starts at $861 where the monthly S1 pivot aligns with recent rejection wicks, followed by the more substantial barrier at $900-906 containing both round-number resistance and the monthly pivot middle. Each failed attempt to break $900 this week added more supply to this zone as trapped buyers liquidated underwater positions.
Bulls now guard the $800 psychological level after six successful defenses since October, with the weekly S3 pivot at $789 providing the absolute last line of defense. The support architecture shows surprising resilience considering the month-long bleed – buyers emerged at $791 during this week’s test, suggesting institutional interest at these discounted levels. However, the derivatives market volatility spike indicates leveraged positions remain vulnerable to liquidation cascades if $800 fails.
Crucially, the market structure reveals a compressed battle zone between $789-861, roughly a 9% range where the next directional move likely originates. The shattered $1,080 level that triggered December’s collapse now sits as distant resistance, requiring a 30% rally just to revisit – highlighting how much technical damage occurred during this month’s distribution phase.
Bears Target $789 Break While Bulls Need $900 Reclaim
Bulls require a decisive daily close above $900 to neutralize immediate selling pressure and build a case for recovery toward the 20-day EMA at $937. Should price reclaim this psychological level with conviction, the oversold bounce could extend to test the $967 resistance cluster where the 50-day EMA converges with December’s breakdown point. The deeply oversold RSI provides the fuel for such a relief rally if buyers can flip momentum.
The bearish scenario triggers if sellers push through $800 support on elevated volume, opening an air pocket down to the weekly S3 at $789 and potentially the yearly low near $750. This breakdown would trap October’s buyers and likely accelerate as derivative positions unwind, creating the capitulation spike that often marks intermediate bottoms. The ADX reading above 35 warns that trend followers would pile onto such a breakdown.
Given the oversold daily RSI against the still-neutral weekly reading, the highest probability path sees BNB chopping between $800-861 support and resistance over the coming sessions. This consolidation would allow the daily timeframe to reset from oversold extremes while the weekly indicators catch up to the recent damage, setting up a more sustainable directional move by early January.