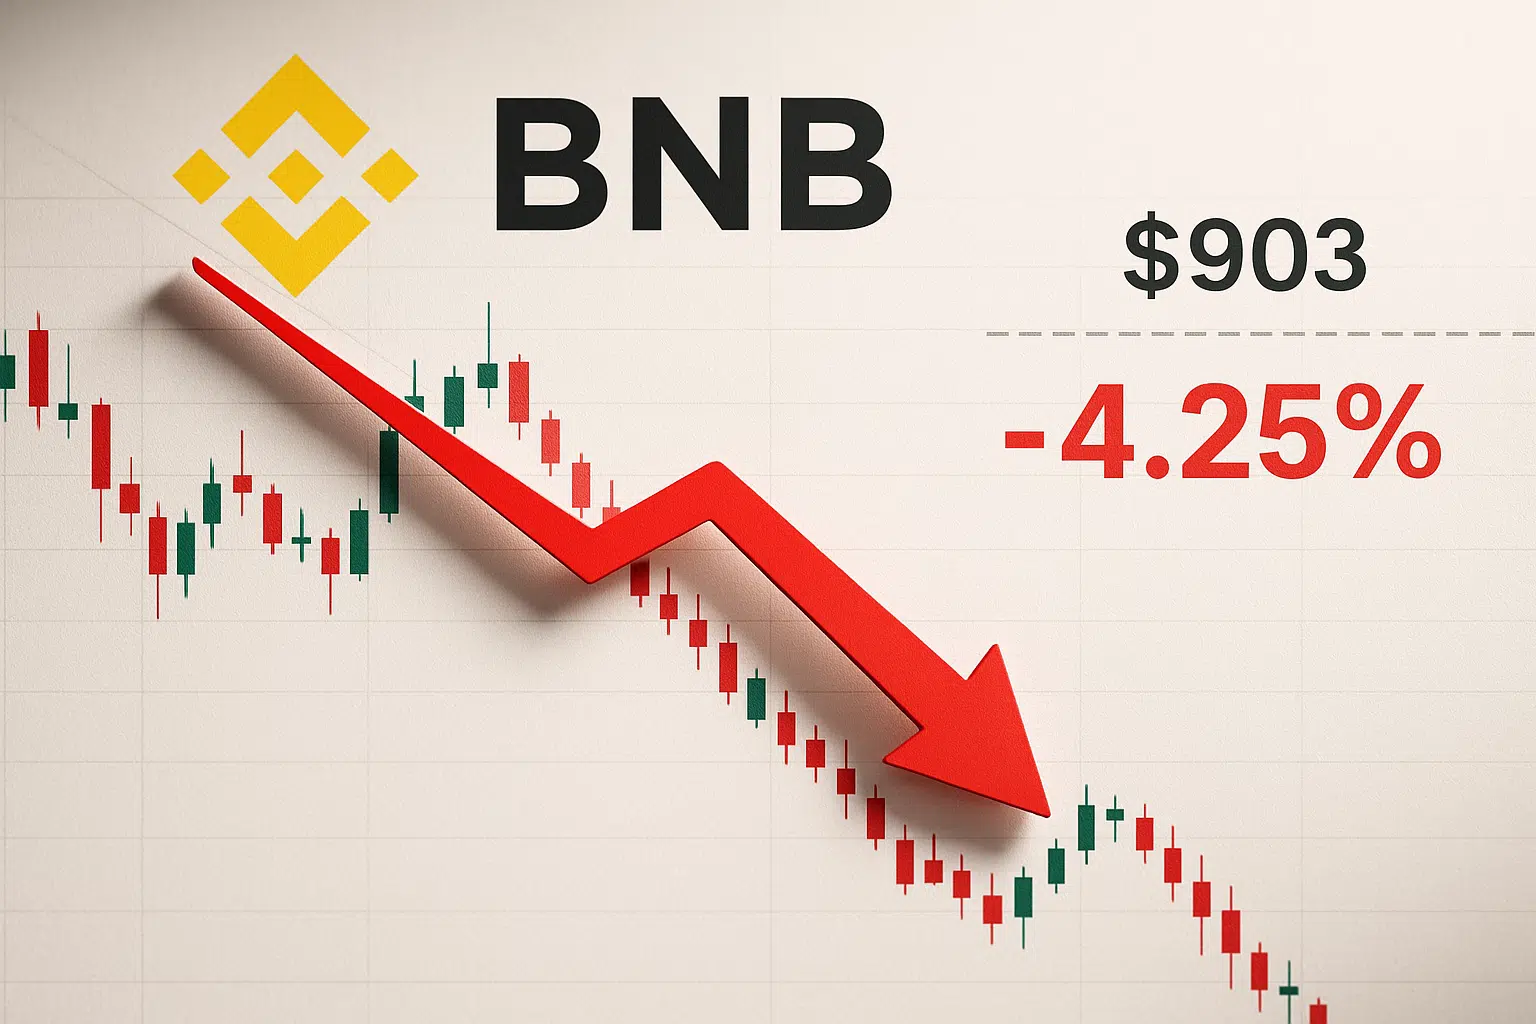
BNB Slides 4.25% as China Reserve Asset News Meets Technical Resistance at $903
Market Pulse
- China Properties Holdings invests a portion of its capital in BNB and acquires Hidden Architecture.
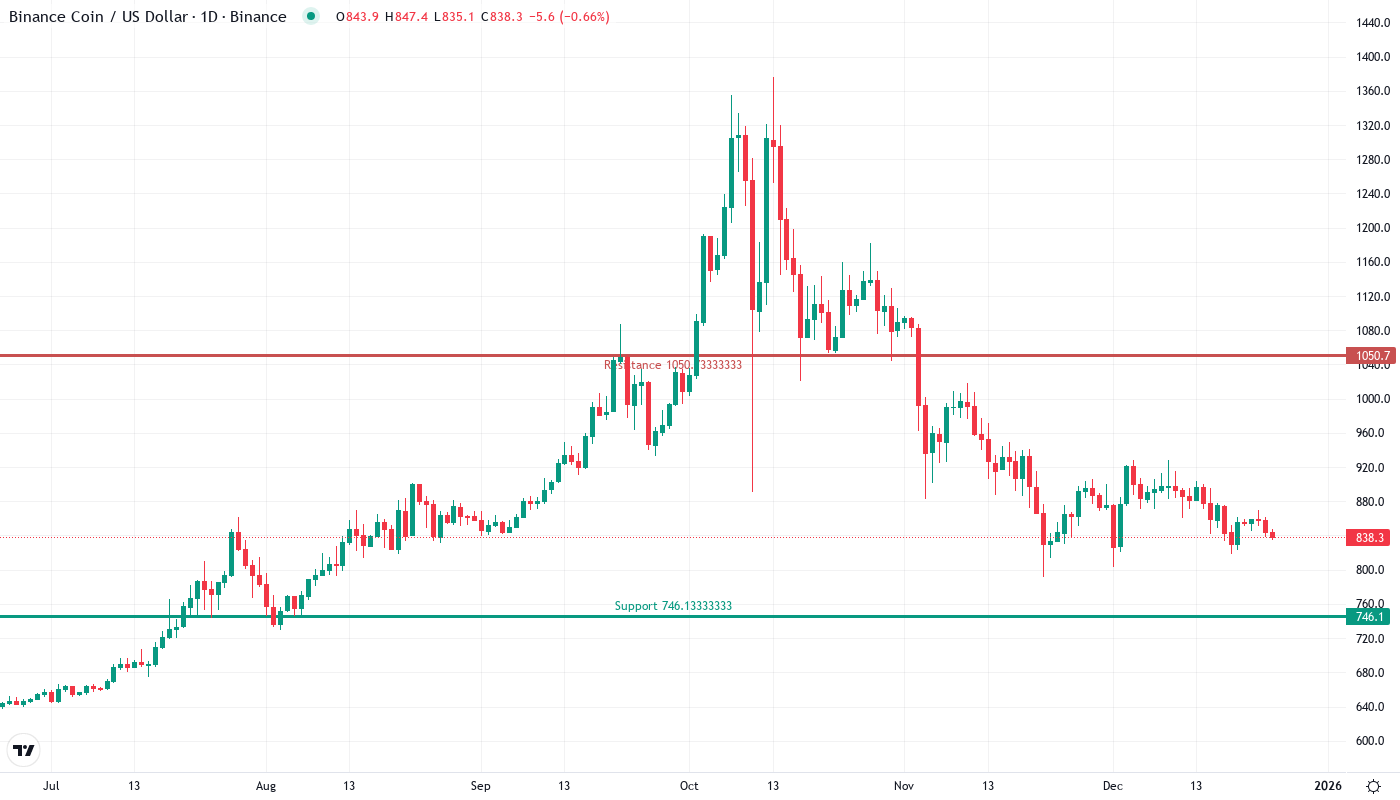
- BNB price remains below a key downtrend resistance structure.
- Momentum indicators remain flat and range-bound with the RSI levelling off at the 50.00 midline.
China Properties Holdings has placed a portion of its capital in Binance Coin (BNB) as a strategic treasury position, in a similar move, the company has acquired Hidden Architecture. In the meantime, the coin price has not been able to break through a key downtrend resistance structure. The relative strength index (RSI) has further retreated to a neutral 50.47 after nearly breaching overbought territory near 60 the previous week. Momentum indicators remain flat and range-bound with the RSI leveling off at the 50.00 midline.
BNB lost 4.25% last week and erased all the gains from the China Properties investment news that saw a quick dose of institutional demand. While this was a key fundamental catalyst and new use-case to demonstrate the ongoing froth in Binance, particularly with the flash loan frenzy exposing another hacker of a ‘rug pulled’ project, offering an additional buy catalyst, the 100-week exponential moving average was touched on the high from the news.
| Metric | Value |
|---|---|
| Asset | BNB (BNB) |
| Current Price | $837.80 |
| Weekly Performance | -4.25% |
| Monthly Performance | -0.63% |
| RSI (Relative Strength Index) | 39.8 |
| ADX (Average Directional Index) | 27.7 |
| MACD (MACD Level) | -16.28 |
| CCI (Commodity Channel Index, 20-period) | -108.44 |
Momentum Resets to 50.47 After Testing Overbought Territory
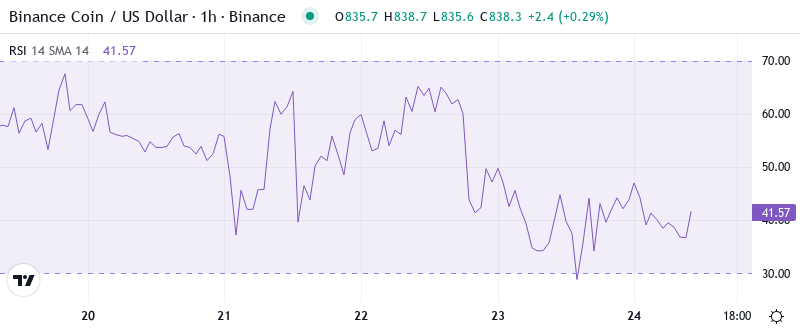
The relative strength index is at 50.47 on the daily timeframe, a straight reset to neutral territory after rising to 60.55 (overbought) during last week’s rally on China Properties stocks. This neutral reading indicates that bulls and bears do not have a momentum advantage, so prices could continue higher or lower without resistance.
The series of momentum setups in early December predated BNB’s run from $636 to $928 – a 46% rally that set the current trading range. For swing traders, this RSI reset coupled with healthy reserve asset fundamentals appears an attractive technical pause meets positive narrative scenario. What sets this cycle apart, however, is the institutional imprimatur via China Properties’ allocation, introducing an additional layer of fresh catalyst to prior cycles.
ADX at 27.71 Signals Trend Strength Building From Recent Chop
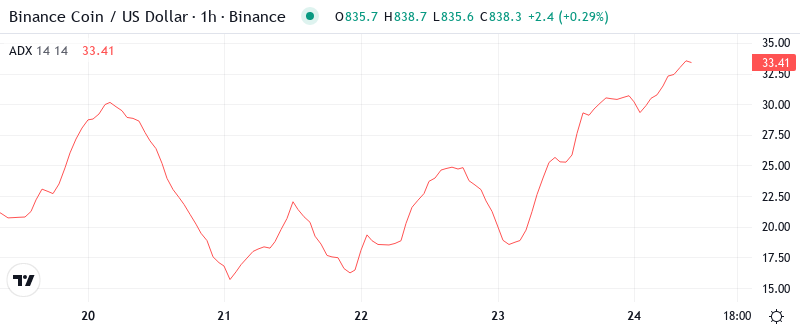
When we examine trend strength indicators, we see that ADX reading is 27.71 and is steadily increasing from the low-20s that it was stuck in throughout the December side-to-side movement. Moving above 25 suggests that we are shifting from a market that is bound to a market more directional — but the direction of the trend is still being disputed at present rates.
In simple terms, when ADX breaks through 25 and price is at a level where it’s historically struggled to pass, the market has tended to see strong, broad-based directional moves rather than choppy, indecisive price action. So be ready for a bit of excitement and some attempts to push the price of BNB out of its current range by the big boys – especially with the ADX on the rise, any move is more likely to be a strong one.
20-Day EMA at $854 Becomes Critical Support After December Rally
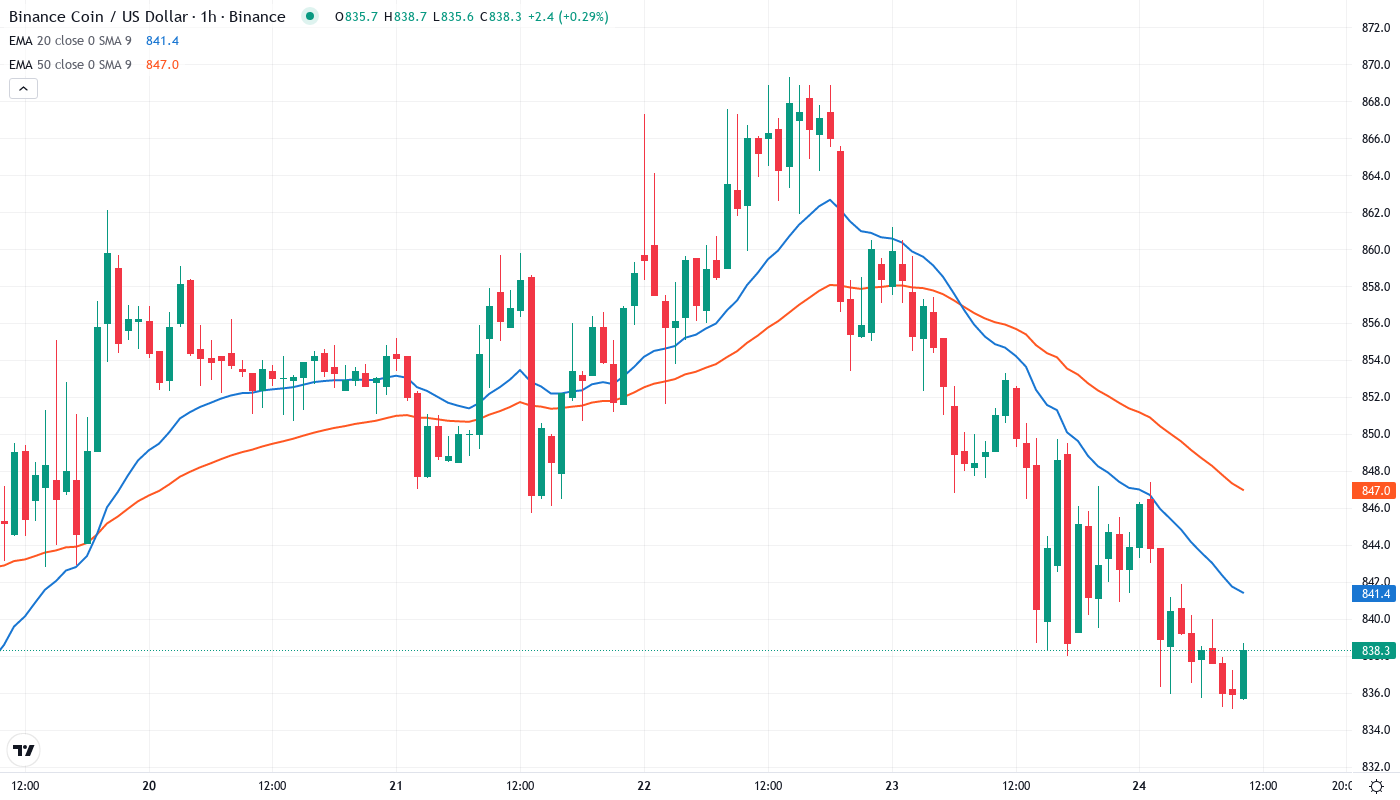
The current price action is consolidating below the record high $956.01 all-time high set on Thursday, continuing what is now the third consecutive day of losses. Should the losses extend, initial support is located around the upward trendline support at $802.00-$810.00, with the 20-day EMA found just below this at $865.80 to catch any additional downside.
What is interesting to notice is how the 100-day EMA sits at $903.31 capped movements exactly the position the highs of December reached – this level has rejected the price three times in the last sessions even with the positive headlines on the China Properties front. With the level of resistance coming from the technical element and the psychological zone of $900 is forming one of the most challenging resistance for the bulls to come. The former resistance spot will now be turned into the major resistance and crossing the same will require an increase in purchasing consistently and is probably going to be induced by additional news on institutional adoption.
Resistance Stacks Between $903 and $928 While Support Layers Build Below
Sellers are not willing to let the price go up easily and there are multiple resistance levels. The first resistance is where the 100-day EMA (Exponential Moving Average) is trading at $903.31. The resistance then increases to $928.50, which is the high of December. This level has blocked three rallies in spite of the positive news related to the reserve asset. This means that the sellers at higher levels are defending aggressively.
Supporting the Bulls guard is increasing a powerful structure under the prevailing price, it anchored by the monthly pivot at $814.31 that belied last week’s decline was the early line in the sand blocking a slump. Next, defense lines reached the 50-day EMA ($878.39) and 20-day EMA ($865.80). This constructs several bounce zones before any impairment gets literal.
Importantly, the market structure indicates that buyers are defending higher lows – from $520 in November, to $636 in December, to $814 last week. This upward support trend will stay in place as long as BNB remains above $800 on a potential pullback, with the China Properties news justifying institutional investors continuing to buy the dips.
Bulls Need Decisive Close Above $903 to Confirm Institutional Momentum
If BNB manages to reach above the $903 resistance cluster, then it can easily pave its way towards the December highs at $928.50, and likely the psychological $1,000 level. The perfect fuel for such a move is the reserve asset narrative, which can successfully attract more institutional adopters just like China Properties.
If the price fails at current levels and instead breaks below the $814 monthly pivot support, we may see a bearish scenario unfolding. This would also be accompanied by higher volume, indicating a stronger downward movement. In this case, buyers who entered the market after the China Properties news would be caught and the 200-day EMA would be the next target, currently standing at $879.48. A further retracement toward $750 could also be possible if the 200-day EMA is breached.
With the technical reset to neutral RSI, rising ADX signaling trend development, and fundamental support from institutional adoption the most probable near-term path sees BNB consolidating between $814-$903 while building energy for the next directional move. Watch for either additional reserve asset announcements to catalyze an upside breakout or technical rejection at $903 to call for further consolidation.