BNB Bulls Guard $826 Support as VanEck ETF Filing Sparks Institutional Interest

Market Structure Shifts Higher
- BNB trades at $826.8, down 24% monthly but holding critical support after six tests
- VanEck ETF application brings institutional validation to the fifth-largest cryptocurrency
- ADX at 35 signals genuine trend strength building from compressed levels
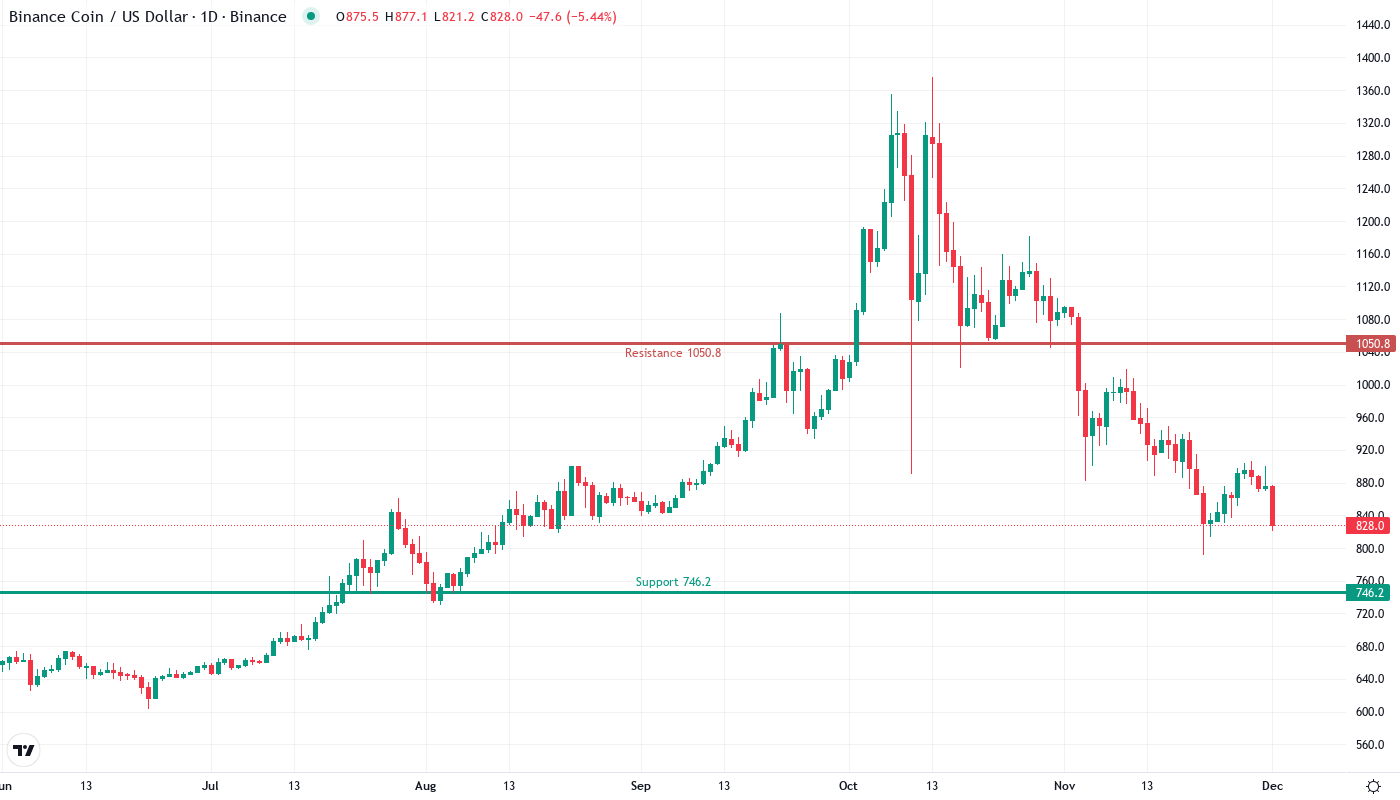
BNB’s price action tells a story of resilience amid broader market turbulence, with the token defending $826.8 despite absorbing a devastating 24% monthly decline. The VanEck ETF filing couldn’t prevent the initial selloff from December’s $1,095 peak, but it’s now providing a psychological floor as institutional interest builds. Looking at the three-month performance of -2.2%, BNB actually outperformed many altcoins during this correction phase. The main question for traders is: can this ETF catalyst transform $826 from a temporary bounce zone into a sustainable launchpad for recovery?
| Metric | Value |
|---|---|
| Asset | BNB (BNB) |
| Current Price | $826.80 |
| Weekly Performance | -1.93% |
| Monthly Performance | -24.08% |
| RSI (Relative Strength Index) | 32.9 |
| ADX (Average Directional Index) | 35.1 |
| MACD (MACD Level) | -37.69 |
| CCI (Commodity Channel Index, 20-period) | -103.69 |
Momentum Exhaustion Signals Capitulation Complete at Current Levels
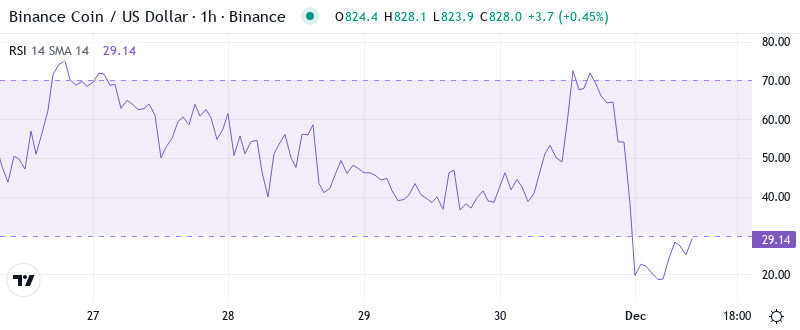
RSI sits at 32.9 on the daily timeframe, marking the first oversold reading since the August washout that preceded a 40% surge. What’s interesting is how momentum indicators across multiple timeframes align – weekly RSI at 46 and monthly at 59.8 suggest the longer timeframe remains far from exhausted. This divergence between daily oversold conditions and healthier weekly/monthly readings typically marks quality buying opportunities.
So for swing traders, this balanced multi-timeframe RSI configuration means the risk-reward heavily favors accumulation over chasing breakouts. The VanEck news essentially put a floor under sentiment just as technical indicators reached their most attractive levels since summer. Similar RSI configurations in September preceded BNB’s march from $500 to $700 within six weeks.
ADX at 35 Confirms Sellers Running Out of Steam After December Flush

At the level of 35.07, the ADX entry indicates that December’s downtrend carried real conviction but now approaches exhaustion territory. The +DI reading of 13.99 versus -DI at 30.4 tells us bears still control direction, yet the overall trend strength reading suggests they’re running on fumes. Basically, being in this zone means we’re transitioning from trending conditions back toward consolidation – exactly where major reversals often originate.
Therefore, day traders should adjust their strategies from trend-following to range-trading setups. The combination of oversold daily RSI with ADX showing trend exhaustion creates a high-probability bounce environment. It is worth mentioning that institutional players often accumulate during such technical configurations, and the ETF filing provides the fundamental catalyst to justify entries at these levels.
20-Day EMA at $896 Becomes First Major Hurdle for Recovery Attempts
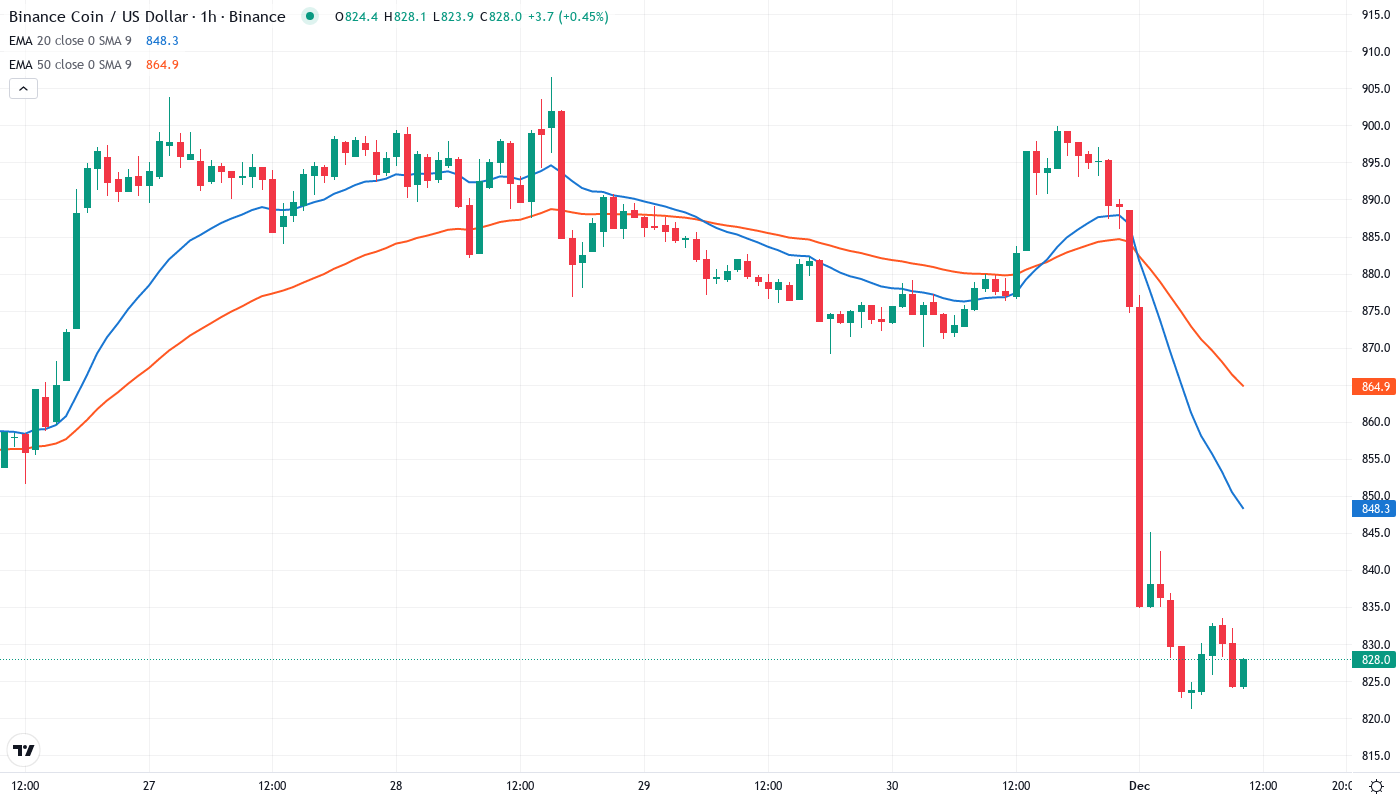
Price action through the EMA ribbons reveals a clear hierarchy of resistance. BNB currently trades below the entire stack – the 10-day ($870), 20-day ($896), and crucially the 50-day EMA at $954. The gap between current price and the 20-day EMA represents an 8.5% move just to reclaim the first meaningful resistance level. What’s revealing is how price bounced precisely from the 200-day EMA at $881 during yesterday’s session, suggesting longer-term buyers defend this critical average.
Moving forward, bulls need to flip the 20-day EMA from resistance to support to signal any sustainable recovery. The 50-day EMA at $954 looms as the more significant test – that level rejected advances three times in early December before finally breaking. This former support at $954 now transforms into a red line that bears will aggressively defend, making it the key level to watch for trend reversal confirmation.
ETF Speculation Reinforces Support While December Highs Cap Upside
The immediate resistance stacks heavy between the 20-day EMA at $896 and the psychological $900 level where trapped longs from mid-December await exits. Above that, the 50-day EMA at $954 coincides with the weekly pivot R1 at $906, creating a confluence zone that should cap initial recovery attempts. December’s peak at $1,095 feels distant but remains the ultimate target if ETF approval momentum builds.
Bulls now guard the $826 support they’ve defended six times since the VanEck news hit. The monthly pivot point at $746 provides a deeper safety net, though losing $826 would trap recent ETF speculation buyers and likely trigger stops down to $800. Kazakhstan’s central bank considering $300 million in crypto investments adds another layer of institutional support to the narrative, reducing the probability of a deeper flush.
Crucially, the market structure signals buyer commitment as long as BNB holds above $826 on any retracement. The compression between this support and the $896-$954 resistance zone resembles a coiled spring – with the ETF decision timeline providing the catalyst for directional resolution. Volume patterns show accumulation rather than distribution at these levels, suggesting smart money positions for the next leg higher.
Bulls Must Reclaim $896 to Validate ETF-Driven Recovery Thesis
Bulls require a decisive daily close above the 20-day EMA at $896 to confirm the bounce has legs. Once secured, the path opens toward $954 where the real test begins – breaking the 50-day EMA while VanEck’s application progresses through regulatory channels would target $1,050 and eventually retest December’s $1,095 peak.
The bearish scenario triggers if BNB fails to hold $826 on increasing volume – this would trap ETF speculators and likely cascade toward the psychological $800 level. A rejection at $896 after multiple attempts would signal the rally lacks conviction, keeping price compressed in the $826-$896 range while traders await clearer ETF timeline signals.
Given the oversold technical conditions, exhausted selling pressure via ADX, and fundamental catalyst of institutional ETF interest, the most probable near-term path sees BNB consolidating between $826-$896 while building energy for a more substantial move. The wildcard remains regulatory clarity on the VanEck application – any positive developments could quickly propel BNB toward that psychological $1,000 target that’s captivated market attention.