Bittensor TAO Tests Critical Support After 30% Monthly Drop as Halving Fails to Ignite Rally
Market Structure Shifts Lower
- TAO down 30.7% month-over-month, trading at $230.10 post-halving.
- Bears control price, facing resistance at $260 and multiple EMAs.
- Support at $215 tested six times; volume surge above $260 required for reversal.
Despite its first block reward halving, Tezos (TAO) is trending down 30.7% monthly, as of Sep 29. Currently trading at $230.1, the bears seem to still be in control. The digital asset’s recovery was short-lived, still caught in the summer downtrend. The announcement of its first halving event, which took place on Aug 6, likely has not had time to affect the price. Relying on the technicals, the outlook is less than positive. On the daily charts, the relative strength index (RSI) has shown oversold conditions—currently at 32.8. Tezos has found support at the $215 level multiple times and will be in danger of losing that level. The resistance for the asset of $260 was lost upon testing multiple times. If bulls hope to recover, there is a need to increase the volume.

Bittensor’s TAO shed 30.7% in one month and is trading at $230.1. The highly awaited halving failed to provide enough momentum resulting in post-event selling pressure. The reaction is a stark difference to what was speculated pre-event. Price quickly pierced through several support levels and found some relief at the monthly low of $215.1. The question is: Will bulls have enough energy to defend this support and reverse the price? Or will sellers be able to push the price even further towards $200?
| Metric | Value |
|---|---|
| Asset | BITTENSOR (TAO) |
| Current Price | $230.10 |
| Weekly Performance | -22.60% |
| Monthly Performance | -30.73% |
| RSI (Relative Strength Index) | 32.8 |
| ADX (Average Directional Index) | 23.7 |
| MACD (MACD Level) | -20.39 |
| CCI (Commodity Channel Index, 20-period) | -200.80 |
Momentum Exhaustion Signals Capitulation Phase – RSI Matches 6-Month Lows
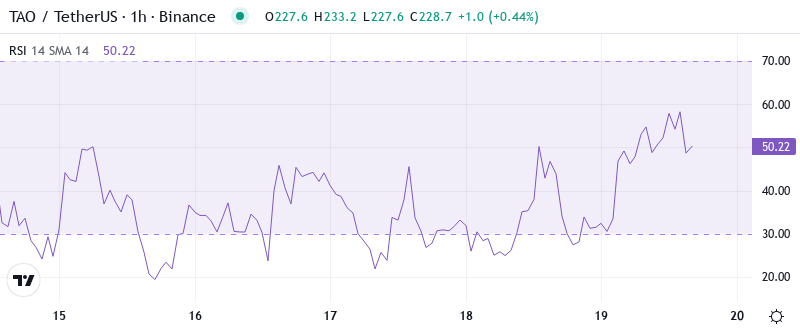
The relative strength index is currently at 32.8 on the daily timeframe, indicating the second most oversold reading in six months. When momentum reaches this level of exhaustion, it often signals capitulation as the weak hands are shaken out of their positions and the smart money begins to accumulate. The halving event reducing daily TAO issuance by 50% had many feeling optimistic for a relief rally, yet sellers quickly absorbed any buying pressure, pushing the oscillator into levels which have historically been followed by strong uptrends.
What is interesting to note is the behavior of RSI both when the halving was announced and when it actually occurred. The indicator rallied to 44.9 on news of the halving, but the “buy the rumor, sell the news” behaviour played out, with institutions taking profit while retail FOMO (fear of missing out) reached a tipping point. For swing traders, the oversold bounce setup is quite attractive from a risk-reward perspective.
ADX at 23.7 Confirms Sellers Control But Trend Losing Steam

When assessing the trend strength of a specific asset, the ADX indicator can be extremely helpful. For BTC’s daily ADX, it currently reads 23.7. This level shows that we are trading in a moderately trending market, but that trend is losing conviction as it only reaches a reading of 23.7.
In the past, whenever TAO faced similar ADX readings, it went through consolidation over several weeks before making a decision. However, this time, the circumstances are different due to the recent halving and the availability of the Virtune ETP for institutional investors. If TAO stabilizes at its current levels, there are high chances that new buyers will enter the market. Hence, short-term traders need to be cautious about the volatile environment as the effects of the halving are balanced out, whereas long-term traders can make the most of this situation by adding to their portfolio.
50-Day EMA at $306.2 Now Acts as Massive Resistance Overhead

The price is below all EMA lines, with current EMA 10-day resistance at $257.9. However, even more troubling for bulls, EMA 20-day resistance is at $274.4, and the critical EMA 50-day level is only a short distance from activation at $306.2 or 33% above the current price. The entire moving average support break occurred at the exact time that post-halving euphoria bumped into post-halving realty and each EMA flipped between support and resistance in a domino fashion.
The 200-day EMA at $345.4 is still far away, showing how much TAO went down compared to the long-term tendency. Bulls need to deal with a lot of selling pressure, and with any rise, they will probably encounter resistance at each of the moving averages. The 20-day EMA, a previous support, is now the first resistance point for a rebound. It would take consistent volume and new prompts in addition to the halving event for a positive change.
$215 Support Holds After Six Tests – Bulls Make Their Stand
Looking further down, the next major areas of support are $208 (daily 50-EMA), $205.6-206.7 (weekly 20-MA and May’s opening price), and $200. The weekly OBV remains in a gradual uptrend, putting it in stark contrast to the distribution evident on lower time frames. Buyers will undoubtedly be pleased that the bullish Pennant was able to meet the measured move in a week; consolidating above it is the next optimal scenario.
There is strong resistance between the weekly pivot at $269.3 and the monthly pivot at $339.7. Therefore, several rejections are likely to occur if the price tries to move upwards. The present resistance is at $258-260 because the 10-day EMA meets horizontal resistance from the breakdown in December. A 20% move is possible soon if the trading range continues between $215 and $260.
The market structure tells an interesting bifurcation – spot price collapsed 30.7% MoM, yet the Virtune ETP launch on Nasdaq provides a regulated, institutional capital-raising mechanism not present during previous cycles. This structural shift, combined with the halving slashing daily supply from 7,200 to 3,600 TAO, leads to the kindling being gathered and any demand uptick situation could trigger outsized price discovery given the reduced float.
Bulls Need Volume Surge Above $260 to Reverse Monthly Downtrend
If TAO can recover the 10-day EMA at $257.9 and do so with force, testing the 20-day EMA at $274.4 would be the next step. Bulls would need to see more buying interest come in over the 10-day average of 15.4 million as it’s currently 18% lower. This will help to create a sense of urgency for potential buyers at the sidelines who remain unconvinced of the demand sparked by the halving narrative. Just as needed, Virtune ETP would be the fundamental fuel, but the price needs to show some technical sparks first.
If $215 support is broken, the likelihood would be a rather swift move down to $200. This would likely come in the form of a stop run before a potential sharp reversal heading back towards our key pivot level at $215. Should the major level at $215 crack, the breakdown of $200 should not attract too much buying interest and could an extended target of $186.
With the oversold readings, six support tests at $215, and institutional infrastructure in place via the ETP the most probable near term path is some consolidation in the $215-260 zone as the market digests the halving’s longer term implications. This is about typical post event price action so patient accumulation rather than over eager positioning long or short. In the bigger picture, the pre-halving TAO’s trajectory isn’t dissimilar to early 2016.