Bittensor (TAO) Plunges 25% as Institutional Products Hit Swiss Markets

Market Structure Shifts Lower
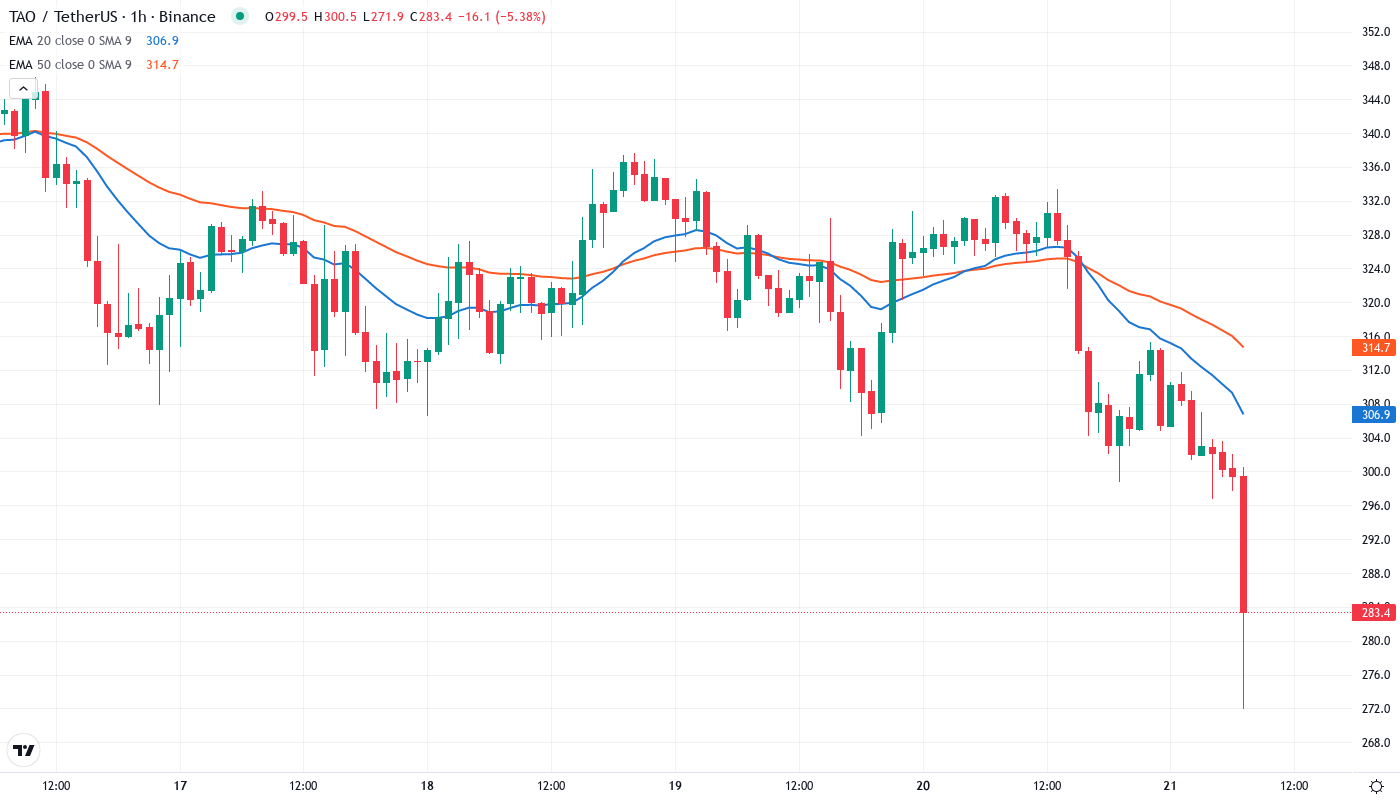
- TAO tumbles from $383 to $284 in a month despite institutional ETP launches
- RSI crashes to 32.33 signaling first oversold condition since the summer washout
- Support architecture between $248-$284 faces immediate test as sellers dominate
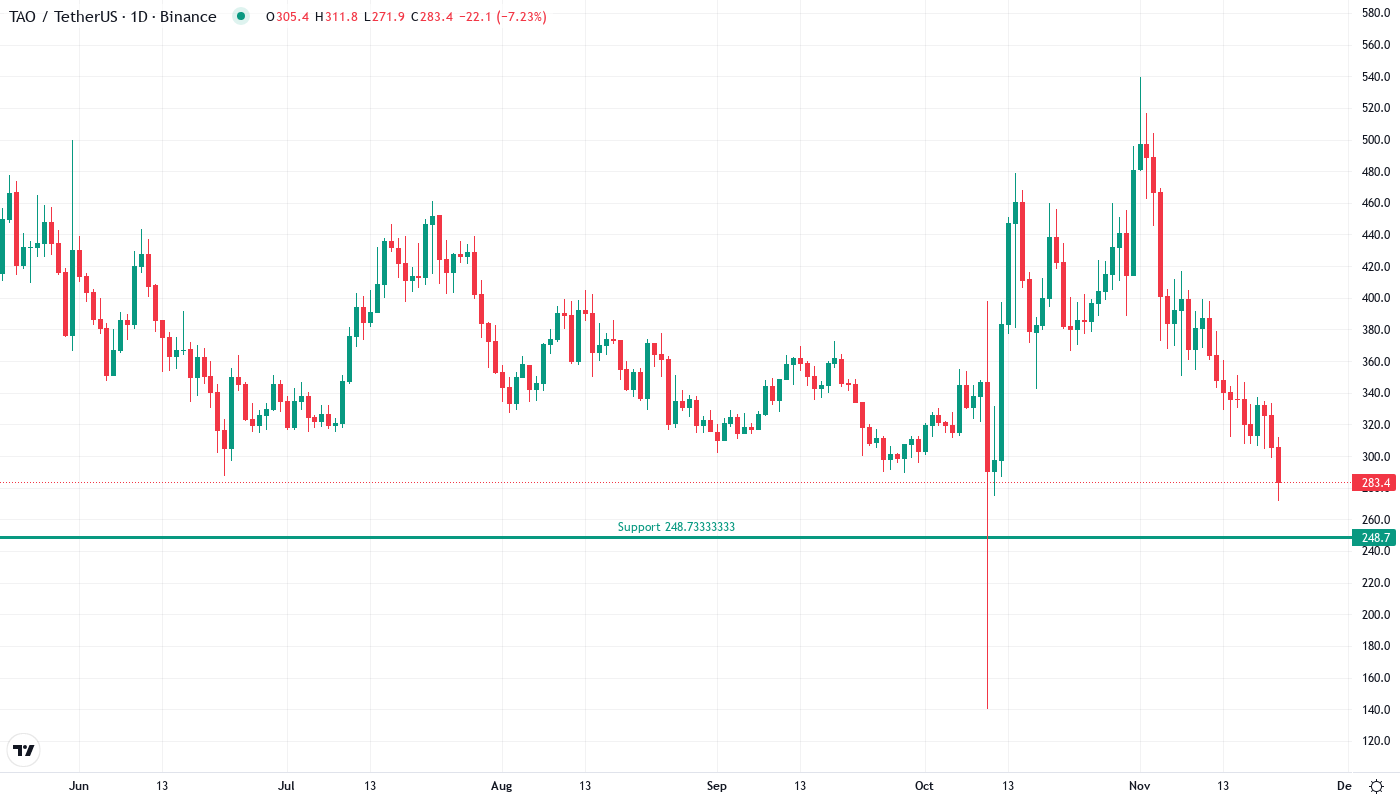
Bittensor has taken the elevator down this past month, shedding 25.65% to trade at $284 after kissing $383.56 in late November. The irony here is thick – while Safello launched the world’s first staked TAO ETP on the SIX Swiss Exchange and Deutsche Digital Assets gained approval on Nasdaq Stockholm, price action tells a different story entirely. The main question for traders is: will institutional product launches provide a floor for this bleeding asset, or are we witnessing a classic case of “buy the rumor, sell the news” playing out in real-time?
| Metric | Value |
|---|---|
| Asset | BITTENSOR (TAO) |
| Current Price | $284.00 |
| Weekly Performance | -16.54% |
| Monthly Performance | -25.65% |
| RSI (Relative Strength Index) | 32.3 |
| ADX (Average Directional Index) | 23.2 |
| MACD (MACD Level) | -25.45 |
| CCI (Commodity Channel Index, 20-period) | -128.69 |
RSI at 32.33 Matches Summer’s Capitulation Zone
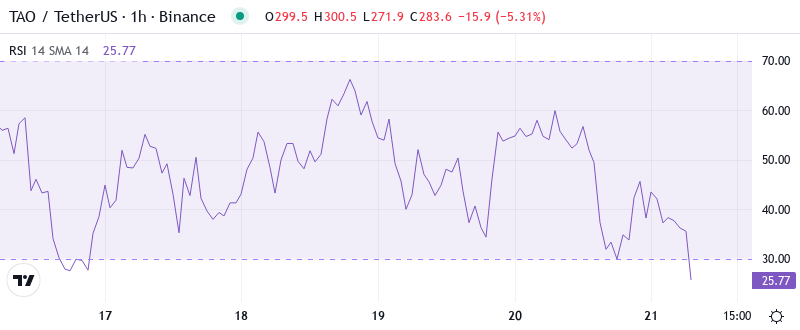
Reading the oscillator at 32.33, we’re staring at oversold territory that hasn’t been this extreme since August’s washout. That’s when TAO found its footing near current levels before staging a recovery rally. Interestingly enough, the weekly RSI sits at 43.00 – not quite oversold yet – suggesting the daily timeframe might be showing us a short-term capitulation rather than a major trend reversal.
So for swing traders, this RSI configuration presents a textbook mean reversion setup, especially with institutional products now providing regulated exposure through Swiss markets. The momentum exhaustion aligns perfectly with the psychological $300 level breaking down, triggering stop-loss cascades that pushed price into this oversold pocket. Whether this bounce materializes depends entirely on buyers defending the $248-$284 support zone with conviction.
Weak ADX at 23.19 Keeps Choppy Conditions in Play
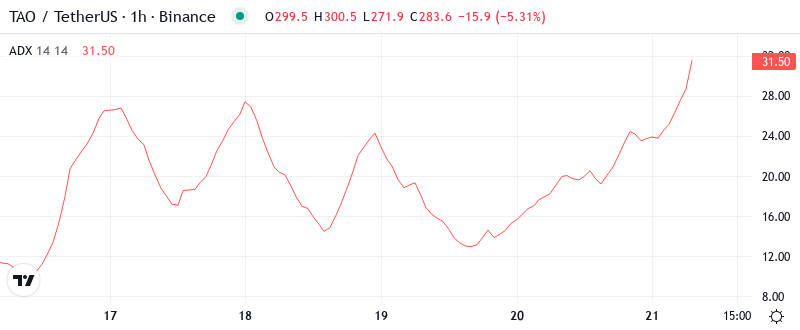
At the level of 23.19, the ADX entry indicates weak directional movement despite the sharp decline. Basically, we’re seeing panic selling without a genuine trending structure behind it – more of a liquidity flush than a sustained bearish campaign. The -DI dominance at 25.93 versus +DI at 10.51 confirms sellers control the immediate action, but the low ADX suggests this could reverse quickly.
What’s revealing is how this non-trending condition developed just as institutional products launched. The market lacks directional conviction, trapped between the bullish narrative of regulated ETP access and the bearish reality of price hemorrhaging 25% in four weeks.
Day traders should adapt to this choppy environment by playing the range rather than betting on continuation moves until ADX climbs above 30 to confirm a real trend.
20-Day EMA at $360.54 Transforms Into Resistance Overhead
Price action is crystal clear through the EMA structure – TAO trades deeply below the entire moving average stack. The 10-day EMA ($325.86) sits 14% above current price, while the critical 20-day at $360.54 now acts as major resistance after supporting the uptrend since October. Most telling is the 50-day EMA at $366.07, which rejected price attempts twice in December before this breakdown materialized.
Looking at the bigger picture, the 100-day EMA waits at $373.55 as the final boss for any recovery attempt. That former support zone around $360-366 now transforms into a resistance cluster bulls must reclaim to shift the narrative. The compression between these averages resembles a ceiling pressing down on price – typical behavior when smart money distributes into retail excitement about new investment products.
Support Stacks Between $248 and Monthly Pivot at $372
Below current levels, buyers defend multiple support layers with the monthly S1 at $248.73 marking the immediate line in the sand. This level has historical significance from summer’s accumulation phase, making it a natural spot for value hunters to emerge. The weekly S1 at $67.93 seems like a data error given current price action, so focus remains on the monthly pivots for reliable support zones.
Resistance clusters between the monthly pivot at $372.26 and R1 at $405.65, creating a formidable barrier for any recovery attempt. This zone coincides with the EMA cloud discussed earlier, forming a double-top resistance structure. Notable is how December’s highs at $383.56 align perfectly with this technical resistance, suggesting distribution occurred precisely at these predetermined levels.
The market structure reveals a classic breakdown pattern – bulls defended $360 support multiple times before capitulating as ETP launch excitement faded. Now trapped below all major averages with oversold momentum readings, TAO faces a critical juncture. The Chainlink partnership announcement and Project Rubicon involvement provide fundamental tailwinds, but technical damage needs repair before sustainable recovery begins.
Bulls Need Reclaim Above $360 to Shift Momentum
Bulls require a decisive close above the 20-day EMA at $360.54 to signal the bleeding has stopped. This would flip the immediate moving average from resistance to support while confirming the oversold bounce has legs. Should institutional flows from the new ETPs materialize, target sits at the monthly pivot around $372, with $405 as the stretch goal if momentum truly reverses.
The bearish scenario triggers if price fails to hold $248 support on any bounce attempt. Loss of this level would trap recent ETP buyers underwater, potentially cascading toward $200 psychological support in a liquidity vacuum. Given the 41% yearly decline despite institutional product launches, sellers remain firmly in control until proven otherwise.
Given the oversold daily RSI, weak ADX reading, and proximity to major support, the most probable near-term path involves a relief bounce toward $320-340 before sellers reload at moving average resistance. Without fresh catalysts beyond the ETP launches already priced in, expect continued consolidation between $248-$360 as the market digests this institutional evolution phase.