Bitcoin Tests Multi-Week Support as Institutional Buyers Defend $87K Floor

Market Structure Shifts Higher
- Bitcoin price has been in a steady uptrend for the better part of a year, recently rallying above $90,000 per coin.
- The median monthly momentum reading shows significant exhaustion of buying pressure and upside momentum overall.
- This signal has appeared four times on the same time frame ahead of a sizable pullback.
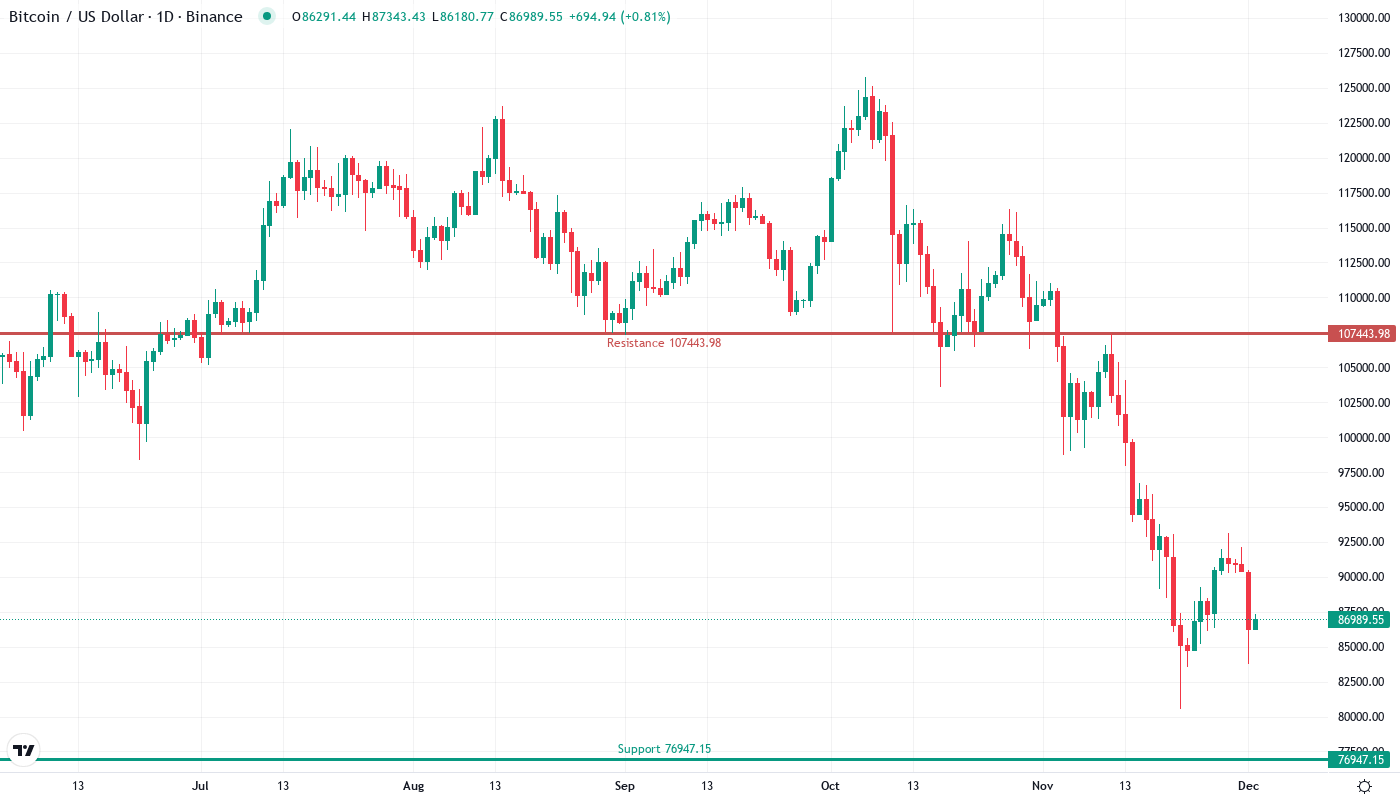
The price of Bitcoin is showing how institutional determination is combining with technical fatigue. The flagship cryptocurrency is now changing hands at $86,944, having shed 20.9% from December’s high close to $110,000. Meanwhile, the stand at these levels indicates that there has been an accumulation of important nature. The most recent 130 BTC purchase made by Michael Saylor underlines all of this, while the floor of the approximately $87,000 region that the market continues to use as a fulcrum has just been tested for the sixth time in the past few weeks. The question is whether this institutional is strong enough to stay upright throughout January’s generally volatile trading.
| Metric | Value |
|---|---|
| Asset | BITCOIN (BTC) |
| Current Price | $86944.05 |
| Weekly Performance | -1.54% |
| Monthly Performance | -20.90% |
| RSI (Relative Strength Index) | 34.7 |
| ADX (Average Directional Index) | 40.0 |
| MACD (MACD Level) | -3784.56 |
| CCI (Commodity Channel Index, 20-period) | -75.27 |
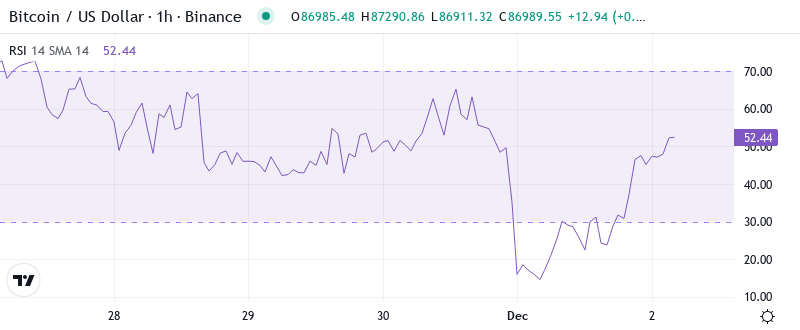
RSI at 51 Signals Neutral Reset After December’s Overbought Extreme
The 15-day differential index is trading at 0.192, but has recently registered levels twice that number. The 5-day average trading index is unremarkable at 0.096, but represents a significant technical explosive potential building under the hood. It likely won’t take too much activity to trigger a break in one direction or the other. Over the last seven months, the daily stochastic RSI has capitulated five times to the downside throughout the turbo trend, with six upside crossovers in the same timeframe.
What is especially interesting is the behavior of RSI during the latest selloff. Even as the price dropped almost $24K from local top to local bottom, the oscillator never spent below 40 – meaning that the sellers did not have enough faith for the final washout (capitulation) push. Therefore, for swing traders, this neutral RSI at 51 implies that the next strong trending move, be it another run at $100K or a retest of the 200-day EMA around $65K, will have technical merit.
ADX Climbs to 40 as Trending Conditions Replace December’s Chop
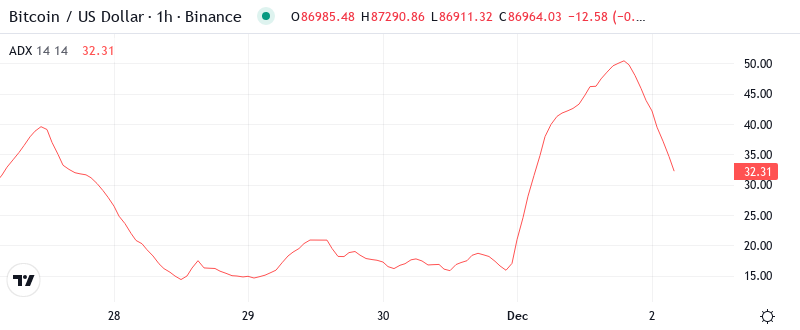
With a reading of 40.04, the ADX shows that we’ve moved from the whipsaw environment in December to a real trend. This is the highest directional strength reading since the November impulse, where levels of ADX over 35 prefaced the march of Bitcoin from $70K to $100K. The market has essentially made a decision after weeks of being indecisive.
Now, trend riders really feel fairly cozy because ADX is saying that the transferring averages it would verify for a steep development or a gently sloping one earlier than being overridden by its own message are pretty much in tune with present worth motion. A number of readings above 25 into a number of weeks, now ticking greater than 40, say this is not an early bullish or bearish lure, but that for those who have missed this shift you continue to have a while to get on board.
20-Day EMA at $91.6K Becomes First Resistance After Supporting Rally
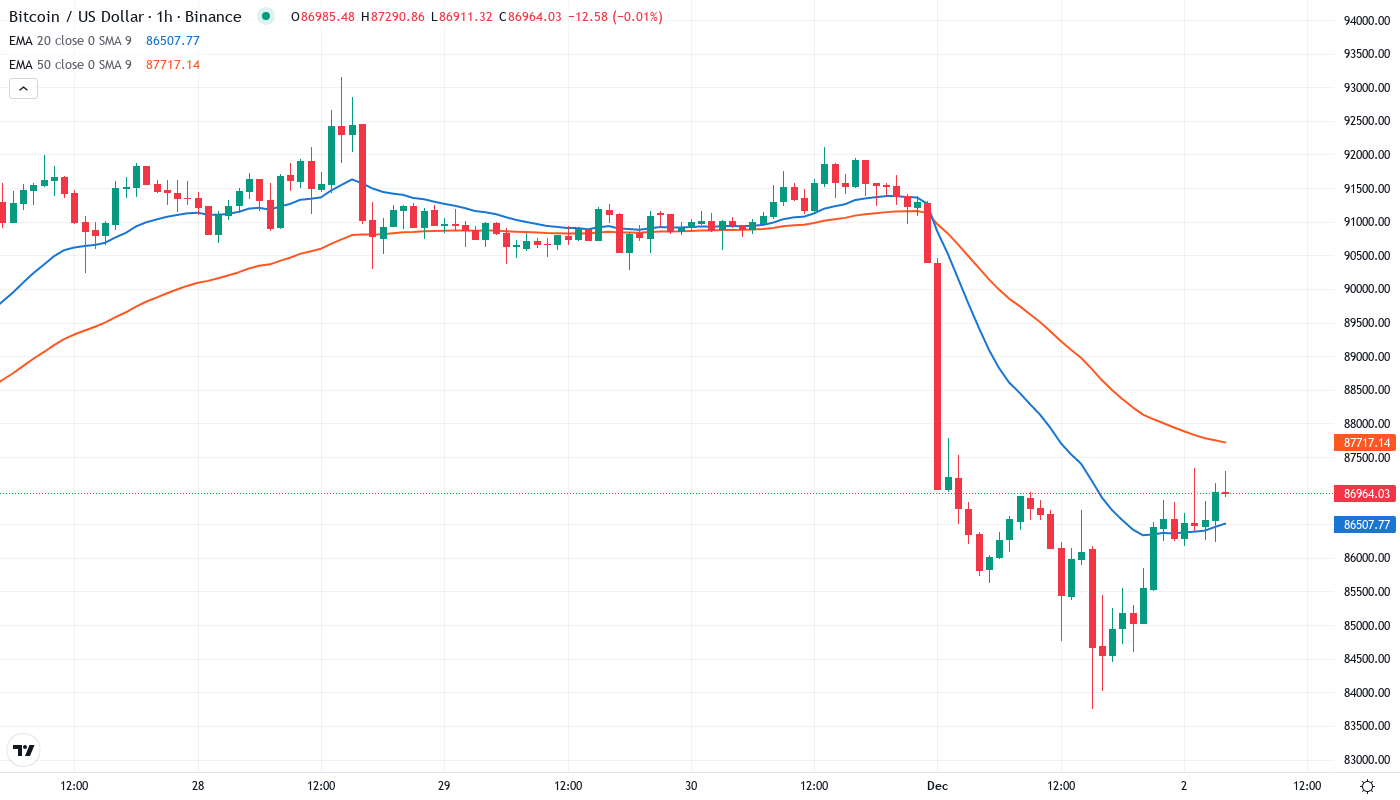
Looking at the daily chart, we can see that the local high of $95.8K has now been tested as both resistance and support. Expect a volatile reaction to a confirmed push above or below this level. MACD momentum and RSI momentum continue down and are far from overextended – unlike, Bitcoin is trading just below the spot confluence. This doesn’t imply another immediate liquidation (though nothing’s off the table), as the longer Price consolidates in current ranges, the larger the breakout will be; those are the rules of the game.
The most important thing is that the 20-day EMA has protected the downside of the recovery in November but turned upside last week. This level must be exceeded to reactivate the upside dynamics. The 50-day EMA of 94.4K is the next critical test as it acted as support for the last jump to 110K in December.
Resistance Wall Between $98K-$103K Meets Support Fortress at $81K-$87K
Above the present levels, sellers have built a robust resistance zone between $98K and $103.7K, the area where December’s breakdown initiated. The zone includes the psychological $100K level and the monthly pivot at $103K, reinforcing a resistance zone that will keep current longs stuck and under pressure from the recent swing high. The hotspot of psychological and technical resistance represents the key battlefield for recovery efforts.
The recent shakeout to $83K and recapture of $85K exceeded the volatility needed to confirm a local bottom. In fact, a “last-point-of-supply” (LPSY) was tagged as the range was broken, providing a last value opportunity for long traders before moving higher. Cross-market correlations have resumed their strength with a weakening DXY, evident in the seven-week winning streak for BTC after consistent losses in the early year. This remains fundamentally supportive for a new range construction above 90% market dominance.
The market structure is showing this coiled-spring setup again between these edges. The compression between $87K and $98K levels is similar to the setups from August and November that produced 20%± impulse moves. With the ADX over 40 and institutional accumulation, this will likely be decided again within the two weeks as volatility/expansion pushes us out of this consolidated/tightened range.
Bulls Require Convincing Close Above $98K to Reignite Six-Figure Dreams
For the bears, the path of least resistance is a daily close below key support at $92K, with a three-step downside targeting range. The first barrier comes at earlier February lows right around $90K, with the next demand zone back in at mid-$80K, and most importantly, December’s $69K macro highs to avoid a complete trend reversal. The point at which long-term investors start to question their “buy the dip” bias and pending reshuffle into the Winter portfolio might be near this level. There remains a strong case for at least 20% more correction before the market becomes more stable.
Smaller caps and those with low float/revenue are having a tough time liquifying positions, so beware the ensuing volatility.
Looking at the latest letter to clients from Blockchain.com’s trading desk, they highlight a small percentage of total Bitcoin on exchanges since the end of last month. Players with fewer than 10 BTC or more than 100 BTC continue their accumulation trends. The 10–100 BTC cohort is flat and holding through the consolidation compared to their small accumulation during the uptrend, but that’s still a symmetrical bias for the sideways range.