Bitcoin Tests Critical Support at $87.2K as Institutional Giants Double Down on Accumulation
Market Structure Shifts Higher
- MicroStrategy added 1,914 Bitcoin for around $90 million at an average price of $47,087 per Bitcoin.
- They now own around 124,391 Bitcoins overall.
- Tidal Investments accumulated $100 million worth of Bitcoin across January and February.
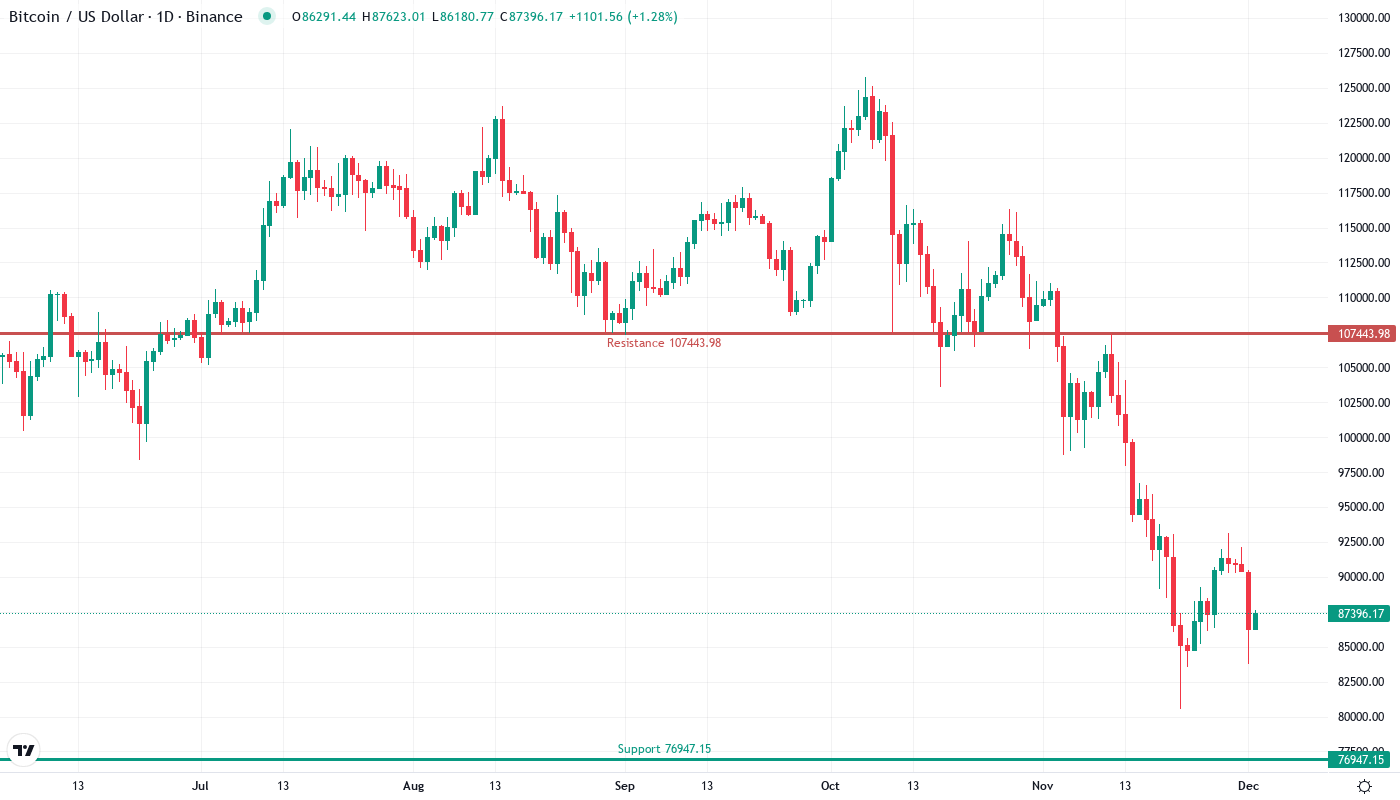
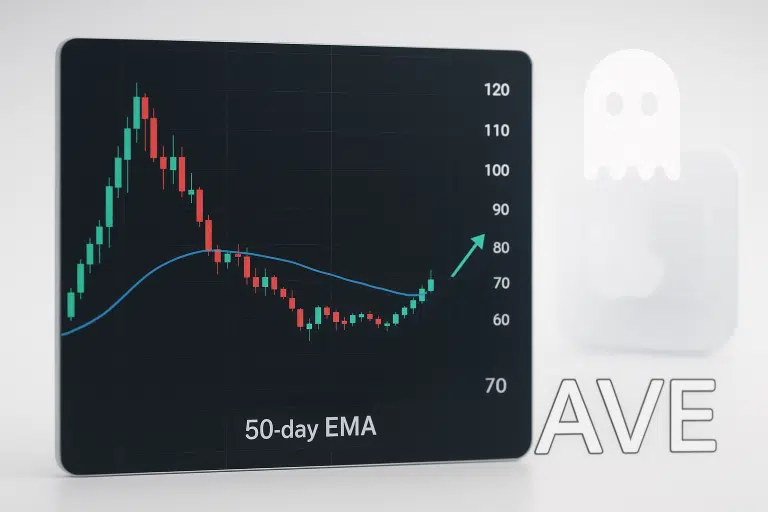
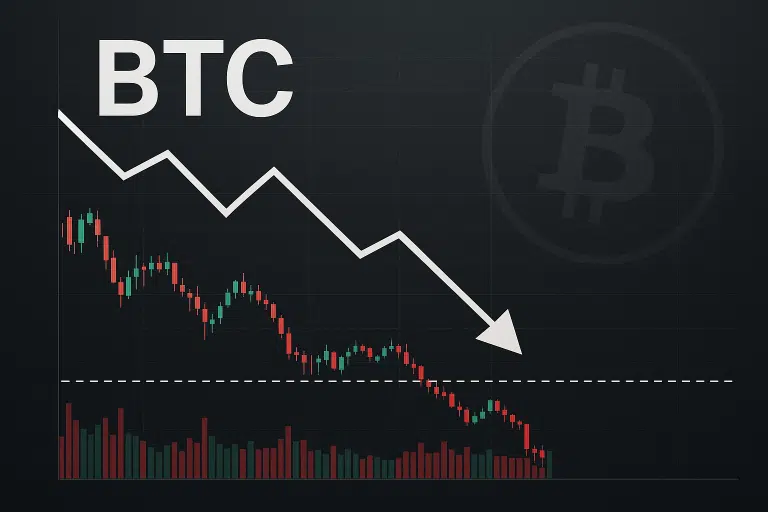
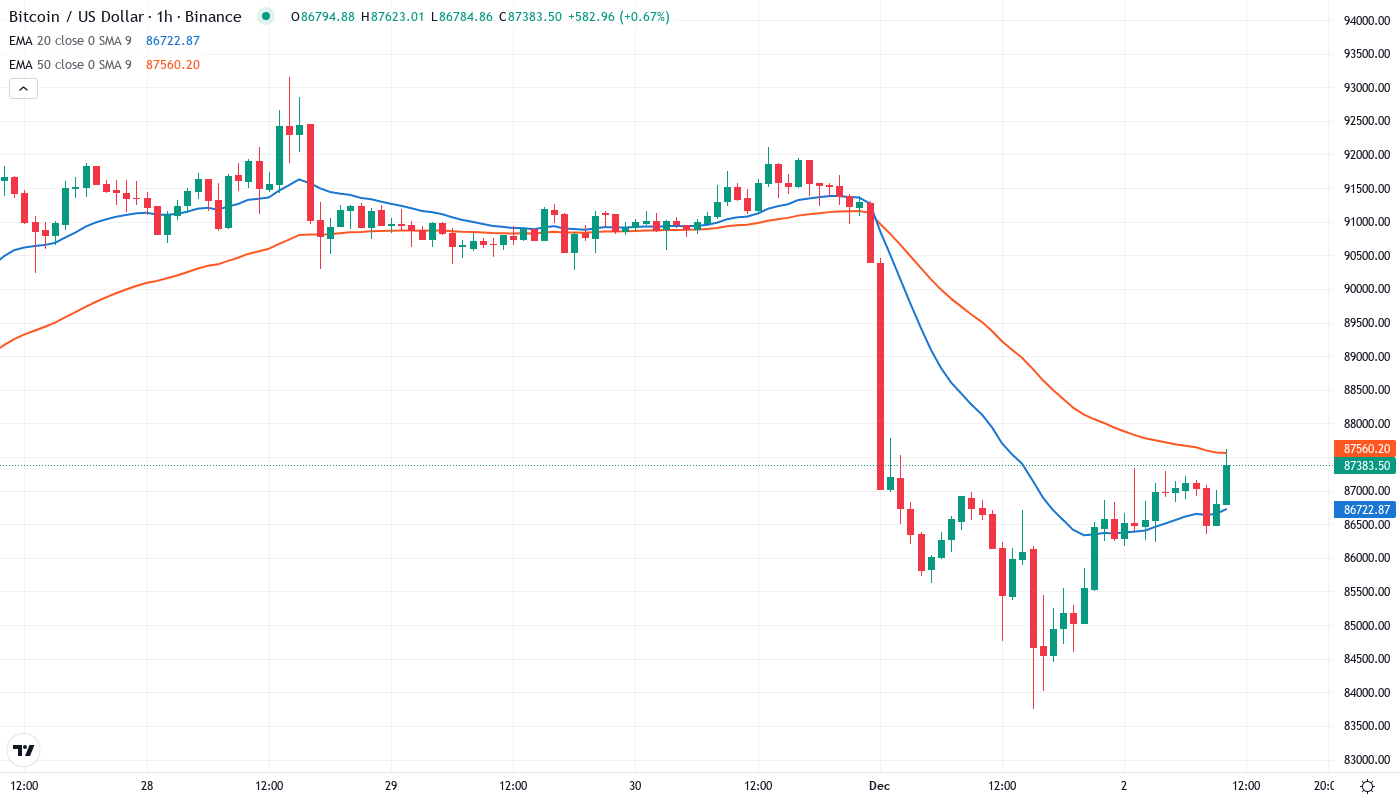
Bitcoin shot back over $87,000 this week, recovering from a 20.64% monthly selloff that had the leading cryptocurrency down more than $22,000 from December’s record close to $110,671. The rally continued apace as Michael Saylor purchased an additional 130 BTC for the MicroStrategy corporate treasury, and Tidal Investments poured an unprecedented $60 million into MSTR shares; institutional money backing up the dip with serious capital. The burning question for speculators is whether that institutional bid at $87,000 will carry us through the weekend, or if the sellers will ultimately prevail over the buyers that have stepped in to protect the 50-day EMA.
| Metric | Value |
|---|---|
| Asset | BITCOIN (BTC) |
| Current Price | $87226.56 |
| Weekly Performance | -1.22% |
| Monthly Performance | -20.64% |
| RSI (Relative Strength Index) | 35.5 |
| ADX (Average Directional Index) | 40.0 |
| MACD (MACD Level) | -3762.03 |
| CCI (Commodity Channel Index, 20-period) | -73.49 |
Momentum Resets to 51.83 After December’s Overbought Extreme
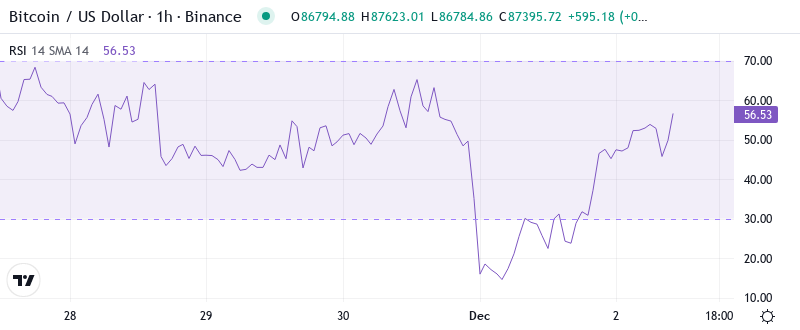
The Relative Strength Index (RSI) for the one-day timeframe is at 51.83. This shows a perfectly neutral situation after the ventilation dropped the oscillator from overbought levels above 70 in early December. This reset eliminates earlier data; no momentum advantage is held by either bulls or bears, leaving the doors open and ready to lead the market in either direction based on the important levels of trading.
What is interesting to observe in this correction is the behavior of the RSI (Relative Strength Index) on the daily timeframe. Unlike most significant corrections that have been brought to oversold conditions (30 on the RSI), the RSI bottomed at around 35. We saw something similar back in September before Bitcoin went on to rally from $52K to $73K. This current RSI picture suggests that sellers don’t have the ‘ammo’ to force a final capitulation event. For swing traders, an RSI in the middle of nowhere suggests there are equally good entries for a move to either direction, but the lack of oversold conditions indicates that there are still plenty of buyers waiting in cheapsville.
ADX at 40.04 Signals Mature Trend Nearing Inflection Point
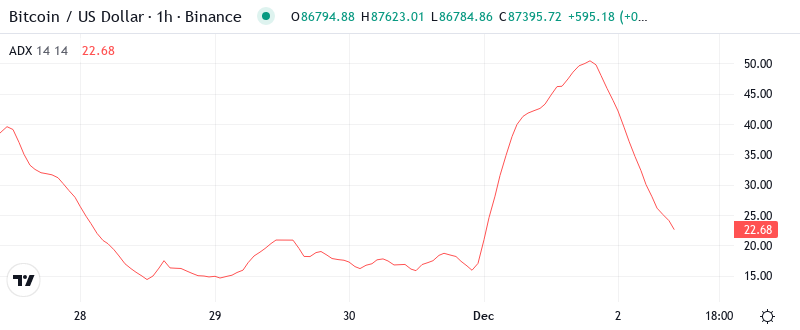
When it comes to trend strength, the ADX currently reads 40.04, one of the highest reads this year. In simple terms, when ADX pushes above 40, it signals that the current trend (in this instance, the downtrend from $110K) has entered a mature stage, and that reversals are more likely. The prevailing trend rarely sees ADX levels this high for long periods without a notable change in trajectory.
In plain English, it means there might not be a sudden turnaround, but it’s likely that the high selling activities we saw in December are starting to decrease. So, day traders, buckle up as things are going to get bumpy and you may need to change your plans because the market situation is changing. Luckily, MicroStrategy and Tidal’s institutional trading occured at the perfect time – just when the downtrend is losing steam.
50-Day EMA at $87K Transforms From Resistance to Critical Support Test
The EMA gap between the 50- and 200-day EMAs is still razor-thin, hovering around 1.5% to the positive side. A full reversion to the mean would see price at $75,760, which is also very near the top of the inverse SFP level defined earlier this month. This critical dynamic implies that should price weaken further, there are several compounding support levels. The noisy range high just below $48,000 is proving a significant area of value and has forced several fakeouts across the range and provides another potential area of support should there be a further drawdown.
For the first time in months, at $96,000 and back at $80,000 the bid dips under strong resistance. Given that such a situation previously led to panic selling, some traders suspect that the smart money is accumulating, satisfied with the prospect of a return to form once resistance flips to support. Reclaiming $113,000 would in turn further solidify the bull case, quashing the remaining doubts, in analyst Scott Melker’s words, that Bitcoin might not hit $100,000 by the end of this year.
Resistance Stacks Heavy Between $90.3K and $94.4K While Bulls Defend $87K
There are various resistance levels above the current price that buyers need to overcome in order to establish an uptrend. The first one is at $90,265, which is the 20-day EMA and a strong psychological resistance level. The next zone is between $93,983 (weekly pivot) and $94,414 (30-day EMA). This is the area where the price broke down in December.
As a result, the price rebounded strongly from the $80,000 level following the news. If Bitcoin can continue holding above the 50-day EMA and break the $92,000 level to the upside, this could signal a short-term reversal back to retest previous local highs. Conversely, failure to hold the 50-day EMA would likely result in the price retesting lower levels.
The current market structure is analogous to a coiled spring, with $87K serving as short-term support and $90.3K acting as resistance. Coiled springs typically lead to 10-15% movements in the direction of the breakout (either $98K or $78K). With ADX showing trend exhaustion and solid dips being absorbed by institutional buyers, I’d tip my hat towards a break to the upside.
Bulls Need Decisive Close Above $90.3K to Confirm Trend Reversal
If Bitcoin should effectively recover the 20-day EMA at $91,657, that would be the initial real trend change signal since the December breakdown. To aim the $94.4K resistance cluster, with a measured move to $98K-$100K, bulls will need a solid close above that level. The Canaan and SynVista renewable energy collaboration, which tackles mining’s ecological issues, might deliver the necessary fuel for such a rally.
If the current consolidation pattern resolves to the upside, bulls will have some minor turbulence from $90K-92K before another retest of $96,300. A breakout there and $88K should be the last line of resistance (now support), so it would likely get extremely volatile at that point.
With a technical reset in momentum indicators, institutional support at current levels, and the ADX signaling trend exhaustion. Bitcoin seems set to consolidate between $87K-$94K before making another attempt to further the prevailing direction. The smart money’s $190 million wager of confidence at these exact levels indicates the market is biased to the upside should the consolidation breakout to the up-side post the current consolidation phase.