Bitcoin Tests Critical Support as US Investors Drive Selling Pressure

Market Pulse
- Bitcoin struggles above $87,000 as US investor selling intensifies.
- Long-term holders accumulate 10,700 BTC, signaling confidence in current prices.
- Price trades between $85,000 and $90,000 amid institutional clarity and bearish pressure.
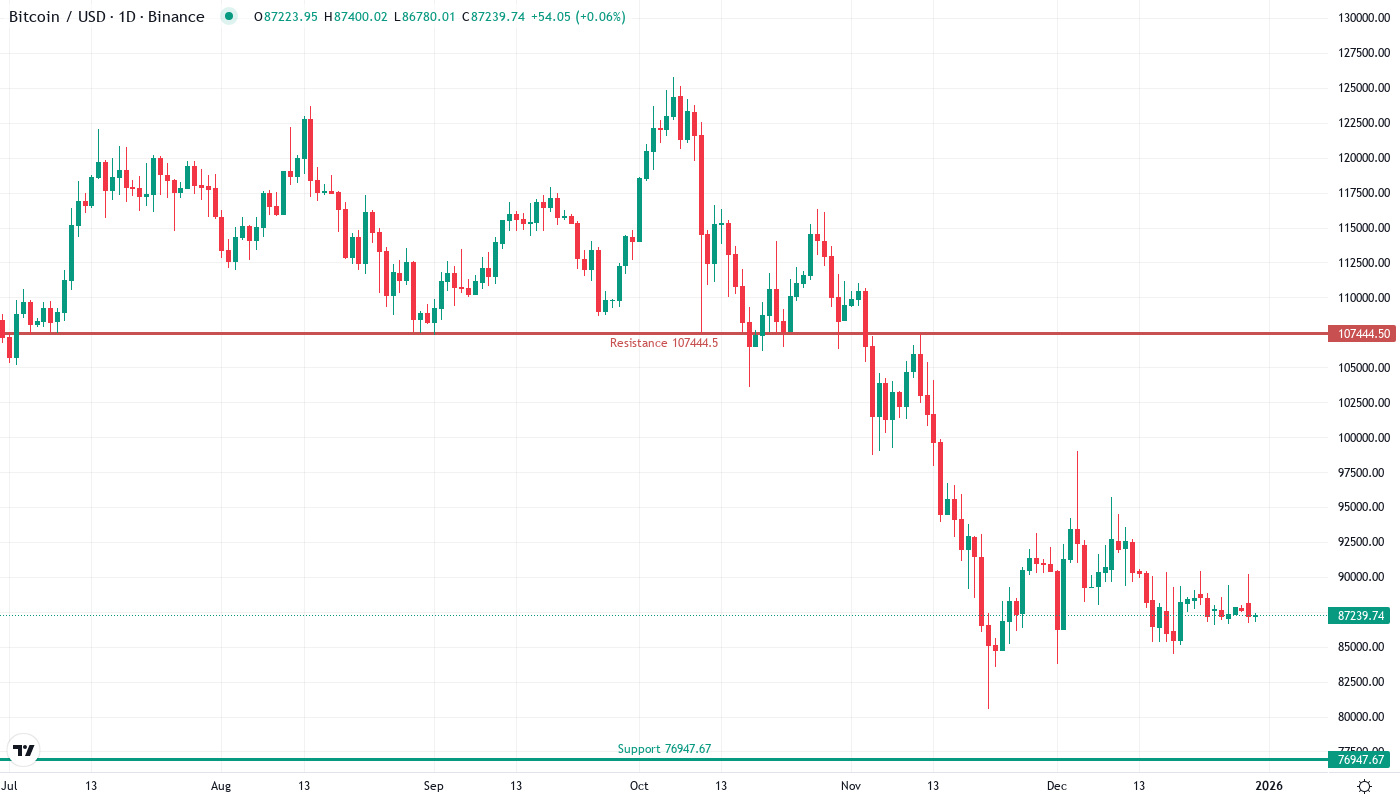
Bitcoin is having a hard time staying above $87,000 because US investors set off reasonably intense selling. This pushed the Coinbase premium to its lowest level in a month. On-chain, long-term holders have accumulated 10,700 BTC, which suggests confidence in current prices. Price action has become sandwiched between $85,000 and $90,000 as the bullish news of institutional clarity from the OCC fights the bearish pressure.
Bitcoin has seen a slight correction since the Coinbase premium plunged and briefly turned negative last week. According to Arcane Research, the premium – which is the difference between the BTC/USD Coinbase Pro price and the BTC/USD spot price on platforms like Binance – dropped to its lowest point in a month, indicating that US traders were spending less on BTC compared to the spot market. A research report on why the premium reached historically high levels last month notes a potential explanation for why it had just sunk: wider adoption of segregated witness (SegWit) addresses.
| Metric | Value |
|---|---|
| Asset | BITCOIN (BTC) |
| Current Price | $87352.36 |
| Weekly Performance | -1.31% |
| Monthly Performance | -3.93% |
| RSI (Relative Strength Index) | 43.5 |
| ADX (Average Directional Index) | 11.9 |
| MACD (MACD Level) | -1075.74 |
| CCI (Commodity Channel Index, 20-period) | -67.41 |
Momentum Exhaustion Signals Capitulation Phase Near Completion
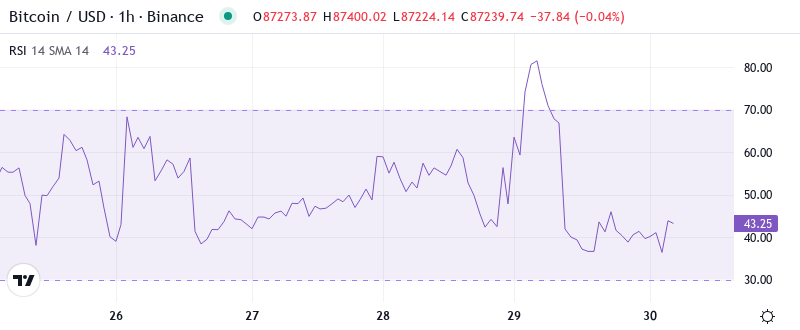
The Relative Strength Index is a popular momentum oscillator that compares the size of recent gains to recent losses in an effort to determine overbought and oversold conditions of an asset. The RSI ranges between 0–100 and readings above 70 are considered overbought while levels under 30 are considered oversold. A common range for oversold conditions is often between 20–30 and it seems we are entering this territory on the daily RSI.
The interesting observation here is the separation in timeframes where daily traders are viewing exhaustion and the weekly perspective shows momentum is balanced. For swing traders this RSI setup implies waiting for daily bounce confirmation over 45 before considering a new swing long. The US investor driven selling seen in Coinbase premium going negative fits perfect with these oversold readings and suggests we are likely approaching a short term low.
ADX at 11.87 Keeps Range Traders in Control
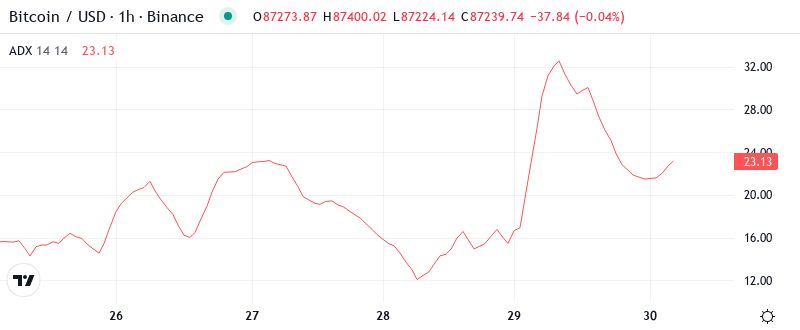
When we talk about trend strength, it is hardly noticeable with ADX at 11.87, one of the lowest readings in recent months. Low ADX means that we have moved from trend conditions that have driven the rally in November to choppy, oscillating, and volatile conditions where bulls and bears don’t have full control. The compression phase usually comes before strong expansion.
In other words, weak ADX readings indicate that day traders are better off switching from trend-following strategies to trading the range. The accumulation by long-term investors of 10,700 BTC during the low-volatility phase is reminiscent of smart money positioning, which tends to precede a big price move in the opposing direction. So be ready for an increase in volatility when the ADX rises above 25 again.
50-Day EMA at $91.9K Becomes Next Resistance Target
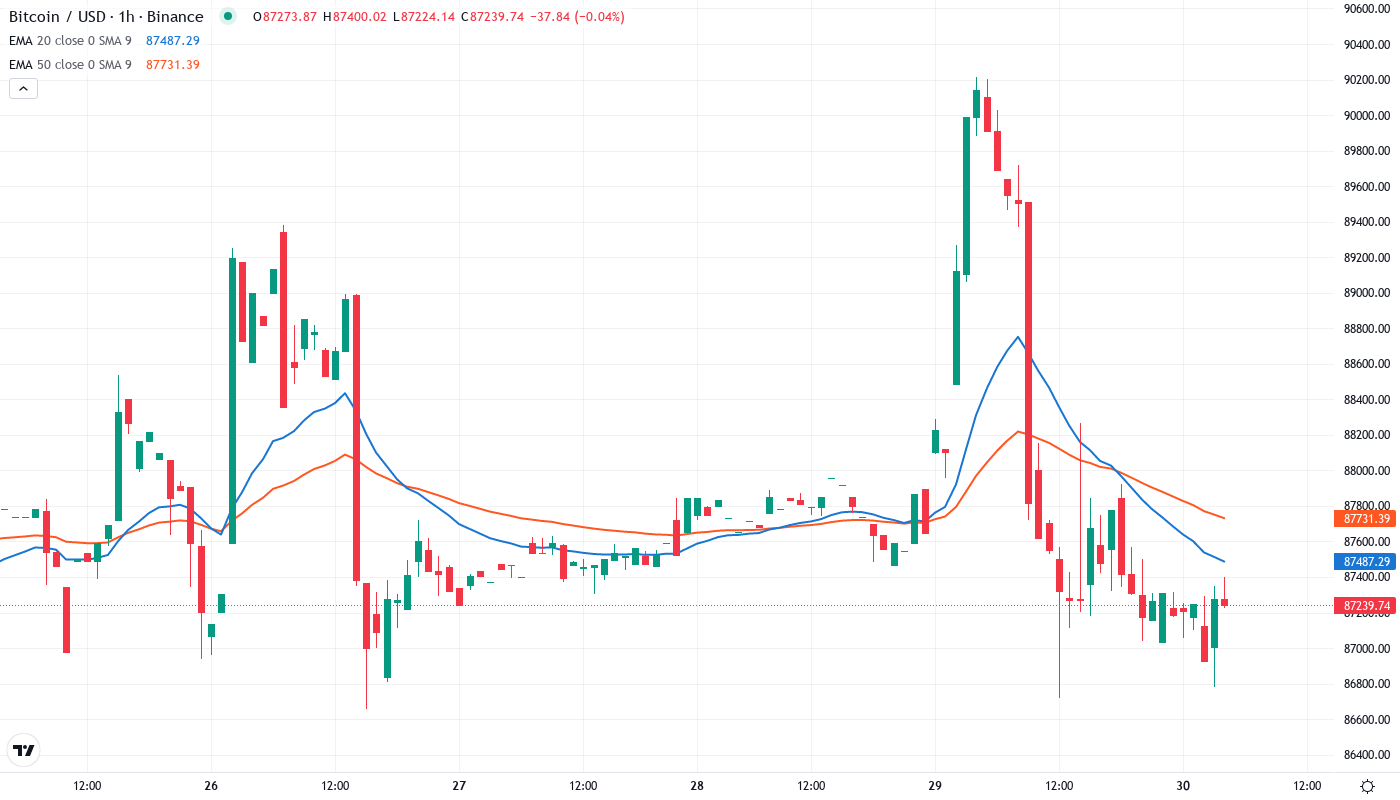
When looking at the EMA ribbons on the multi-day timeframe, we can see a similar confrontation taking place with the overhead 10-day EMA at $90,634 acting as resistance as Bitcoin consolidates short-term within the 20-day EMA and the 100-day EMA.
Even more significant is the squeeze between the 10-day and 20-day EMAs, which are only $615 apart, which suggests that volatility will soon expand. The 100-day EMA, which switched to support after three December tests, now becomes the red line the bulls must maintain. Price tested this level as Michael Saylor announced his $109M Bitcoin purchase, serving as fundamental backing for the technical support.
Support Architecture Builds From $85.7K to $80K
There is a lot of resistance that is building up between the prevailing prices and the key $90,000 level. The first resistance area is located between the 10-day EMA, at $87,606, and the 20-day EMA, at $88,221. More resistance is expected at the 50-day EMA, around $91,886. The December high, near $99,000, seems far away at the current pace, so at least a couple of resistance breaks would be needed to reach this level again.
Bulls are likely to protect several support levels below, beginning with the critical 100-day EMA at $85,764. Next, the monthly pivot support at $81,694, and the 200-day EMA safety net at $80,052 are the major levels below that. The $85K support has been tested six times and is being viewed as an important level as hodlers continue to accumulate at these levels.
Importantly, the market structure indicates buyers stepping in every time Bitcoin retests the $85K area. OCC’s reassurance regarding banks’ participation in crypto gives institutional credence to this support level, indicating that any breaches below it might be quickly retested as smart buyers consider breakouts as chances rather than exits.
Bulls Need Decisive Reclaim Above $88.2K to Shift Momentum
If Bitcoin can recover the 20-day EMA at $88,221, the relief rally could extend to the 50-day EMA at $91,886. The RSI is deeply oversold and long-term holders have been accumulating, which are positive signs for the bulls if the selling pressure from the US abates.
The current consolidation would turn into a retreat. New longs would likely stay sidelined until sweeping the stops, waiting for the next definitive entry. Market psychology would shift to warier, bearish positioning. Old longs with big gains might book profits looking to re-enter lower.
Based on the technical setup and divergent flows from US sellers and long-term accumulators, the most likely short-term trajectory has Bitcoin ranging between $85K–$88K as momentum oscillators cool off. Institutional confidence through regulatory clarity along with smart money accumulating implies that any downside will be short-lived and will provide a chance to enter long positions for disciplined traders.