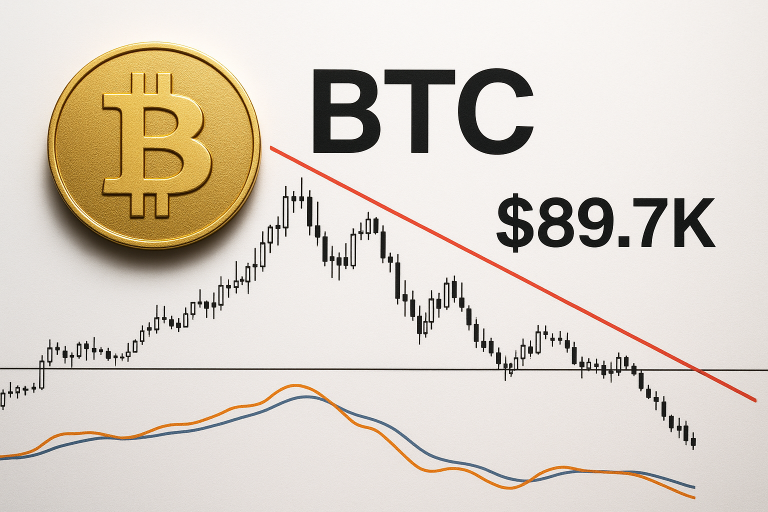
Bitcoin Tests $101.5K as Institutional Money Floods ETFs Despite Monthly Slide

Market Structure Shifts Higher
- Institutional investors struggled to push Bitcoin past the $101545 mark as they mopped up $524 million in ETFs this week
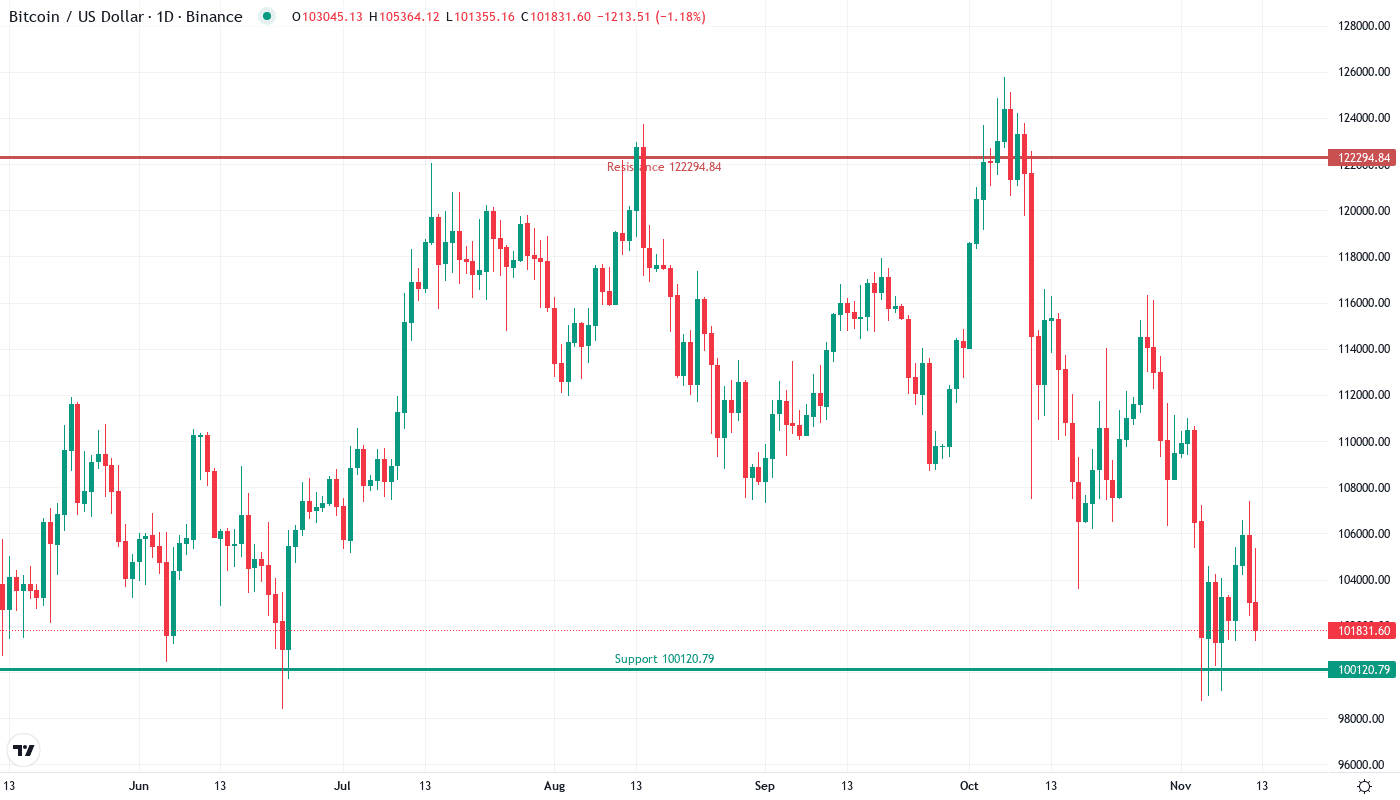
- The price of Bitcoin now seems balanced between the monthly low of $98.7K and the high of $116.3K
- The UK regulatory shift is furthered by the proposed tax cuts for Bitcoin, stressing the adoption of digital currencies
Bitcoin for the month and a little bit more had struggled but now at the end of the month it has managed to make way back to $101,545, which is a strong comeback for the biggest digital wealth. The digital currency lost almost an amount of $14,771 in just a month which made it impossible to hold the three weeks of gains, even in the face of the massive institutional inflows of $524M into Bitcoin ETFs. UK's politicians are considering tax cuts for Bitcoin and SoFi Bank has jumped into the cryptocurrency business, yet the question that all the operators are asking is that: can the institutional support balance the technical loss that was made from December’s slide?
| Metric | Value |
|---|---|
| Asset | BITCOIN (BTC) |
| Current Price | $101545.06 |
| Weekly Performance | 0.06% |
| Monthly Performance | -11.90% |
| RSI (Relative Strength Index) | 38.5 |
| ADX (Average Directional Index) | 27.5 |
| MACD (MACD Level) | -2563.96 |
| CCI (Commodity Channel Index, 20-period) | -79.80 |
RSI Momentum Indicators Flash Neutral Territory
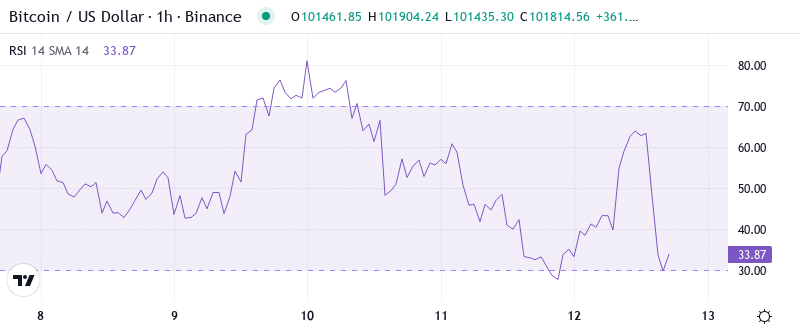
The daily RSI index is currently at 44.88, which exactly places Bitcoin in a neutral position where both buy and sell orders are available. This neutral reading appears after the index dropped from the overbought region above 70 in late November, which was a marked reset of momentum conditions.
In the past, the same RSI setups in September had significant directional breaks right after the readings moved up decisively above 50 or down below 40. For swing traders, this neutral RSI is a signal to lay low because the biggest profit opportunity is in the case when RSI decides the direction either staying above 55 for a significant amount of time or going below 35 especially with the underlying bid support provided by institutional flows.
ADX Trend Strength Building From Compression
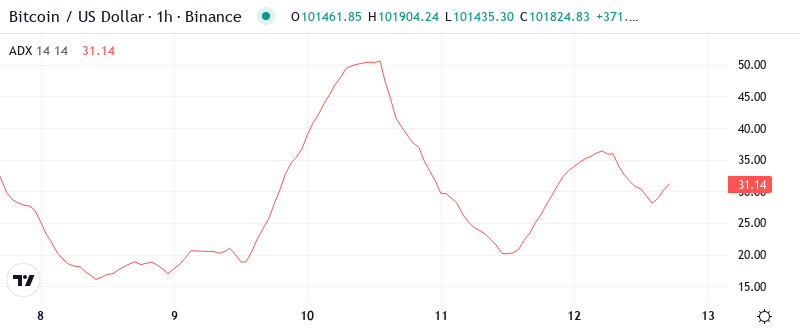
Doing the reading at 27.5, the ADX entry shows that the trend is strengthening but not yet moved to the extremes. Simply being in this range means that we are changing from choppy consolidation which prevailed the early January to a more directional state, trend followers starting to place orders for the next leg.
Just to make it clear, the confirmation of the change of environmental states from the boundary states to the spam existing trend is thanks to the ADX readings – which are the actual moments when institutional money feels safe to rise on positions. So, the day traders must make a change in their strategies by preferring the breakout setups in contrast to mean reversion plays, especially given the fact that the $524M ETF inflows indicate the institutional betting continuation of assets rather than reversing them.
EMA Ribbons Paint Clear Battle Lines
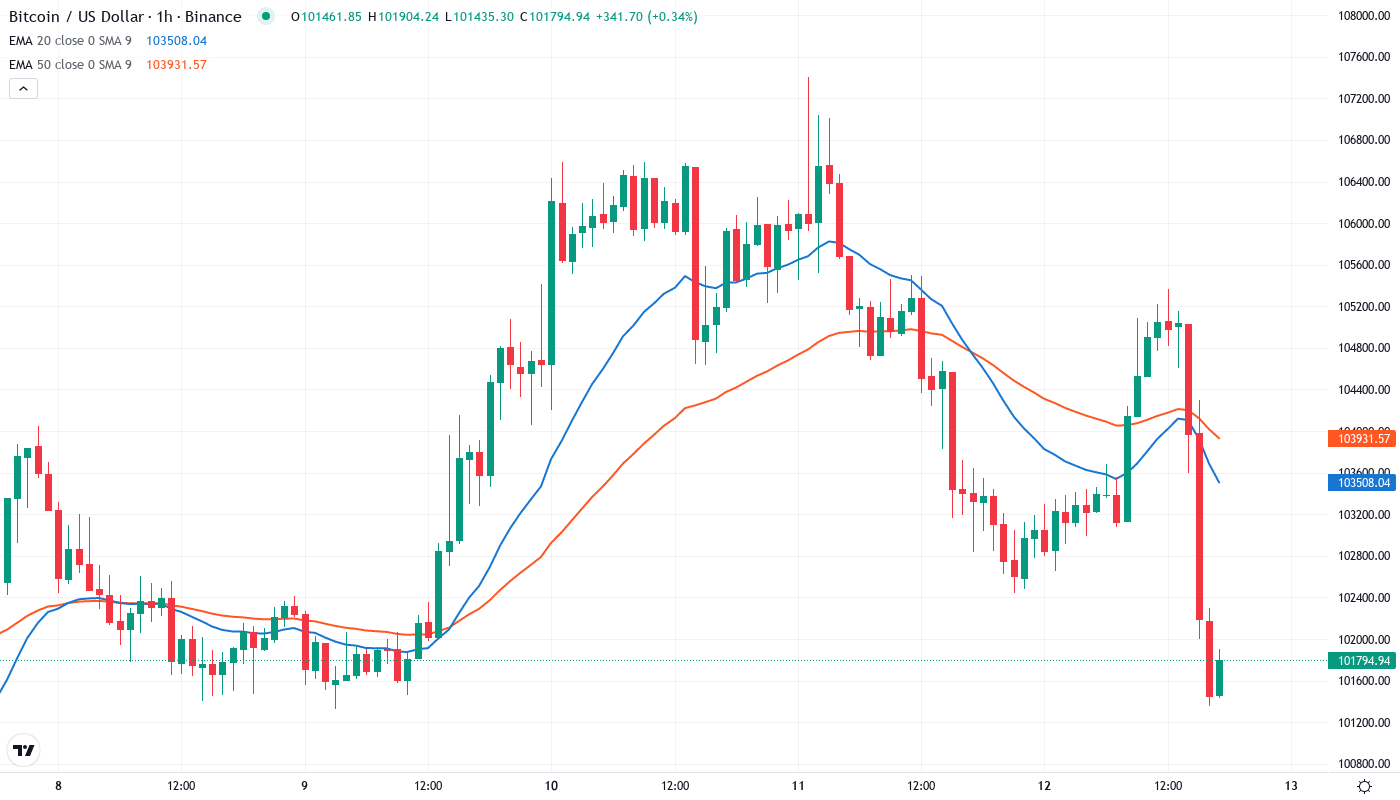
The moving average ribbons of price action tell an interesting story. Bitcoin is currently below the 10-day ($104,233) and 20-day ($106,260) EMAs, but it is essential to underline that it is still located above the 50-day EMA at $109,652 and the 200-day anchor at $107,925. Such a tight configuration has not been seen since the accumulation phase in October.
According to the above paragraph, the 20-day EMA at $106,260 changes from a support to a resistance level, as there were three unsuccessful tests of it this week. This previous support area is now the red line that the buyers need to overcome to prove the actual recovery. On the contrary, the 200-day EMA of $107,925, which is the rise of this moving average, creates the angle between long-term support and short-term resistance that is tighter than ever – a coil of a spring waiting for explosive movement with the backing support of UK regulatory clarity and institutional adoption.
Critical Support and Resistance Zones Define Risk
Right in the zone from $104,233 to $106,260 where the 10-day and 20-day EMAs join with December’s breakdown level, we encounter the first immediate resistance clusters. Above that, the path towards the bullish market structure restoration is cleared by the monthly pivot at $112,941 which is the level that has turned down twice the attempts since the December peak.
Institutional bid depth embody the support architecture, which now is much more solid. The pivoting line of defense is the monthly low of $98,734 that makes this week’s recover bounce possible. Then, the psychological $90,000 level, which is related to the S1 monthly pivot at $90,767, forms a considerable demand zone, where cornered buyers have always bought into the ETF fund heavily.
Market structure provides a clear suggestion of buyer control as long as Bitcoin is staying above the level of $98,734 on any retracement. The short interval between the support at $98.7K and the resistance at $106.2K is reminiscent of a coiled spring that is about to be released. Historically, such compressions were those that resulted in resolution 15-20% in one or the other direction.
The Path Forward: Bulls vs Bears
The blockchain bulls are required to establish a daily close above $106,260, a measure that would stem the EMA reclaim and then make the way for the $112,941 target, while the UK tax reform and the running institutional access continue to be the main factors. A clear breakthrough of the monthly pivot would act as a confirmation of the liquidity patterns that predict a $124K target.
Bearish outlook enacts if the price experiences a strong rejection at $104,233 alongside the volume drop to hard below $98,734. This moment will ensnare the recent buyers and then the price will likely fall to $90,767 causing the placing of the stops at this level. The sign of the trend’s ending is also the ADX going down under 25 and the RSI breaking below the level of 40.
According to the present momentum indicators and the $524M institutional inflows’ fundamental backdrop, the scenario that is most likely to happen in the near term is Bitcoin to trade sideways between $98.7K -$106.2K before taking another shot up as the regulatory understanding gets better.