Bitcoin Slides to $87K as CME Futures Volume Shifts to Ethereum

Market Structure Shifts Lower
- Bitcoin fell 20.8% from December peak, wiping out rise from October
- CME futures trade volume shifts from BTC to ETH and this has never happened before
- Longs liquidations are picking up pace under $90K support according to perpetual futures data
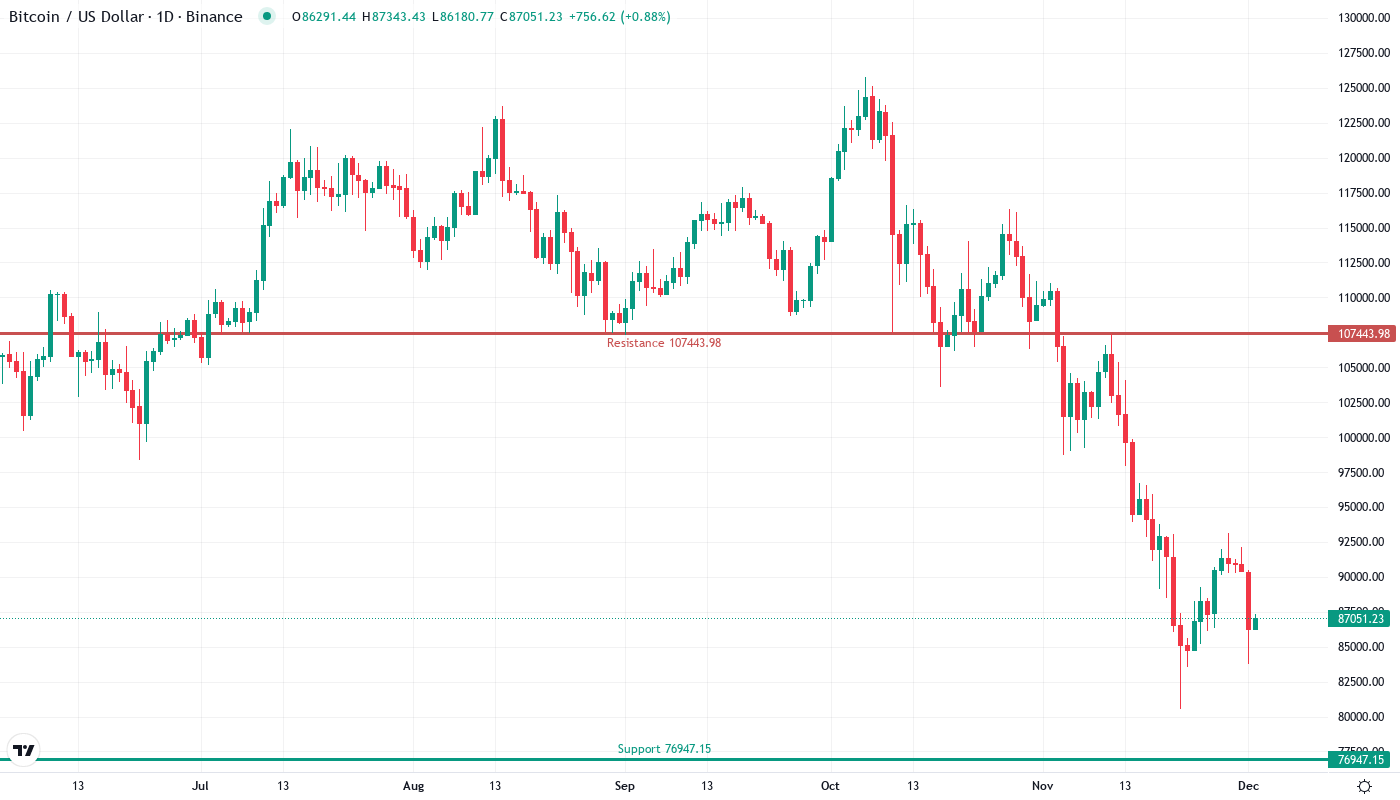
Bitcoin’s catastrophic slump to $87,045 equates to a 20.8% drop from December’s heights, stripping away three months of advances within days. Sell-offs intensified following the release of CME futures volume statistics, revealing Ethereum had overtaken Bitcoin for the initial period, in turn catalyzing a supplanting of institutional cash that overexposed bulls to the downside. The key query for traders is, does such a shift in momentum imply a greater pullback on the horizon, or can the $85K-$87K region act as a bounce?
| Metric | Value |
|---|---|
| Asset | BITCOIN (BTC) |
| Current Price | $87045.98 |
| Weekly Performance | -1.42% |
| Monthly Performance | -20.81% |
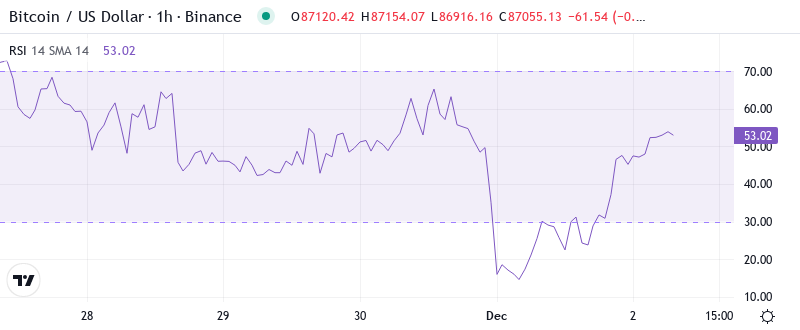
| RSI (Relative Strength Index) | 35.0 |
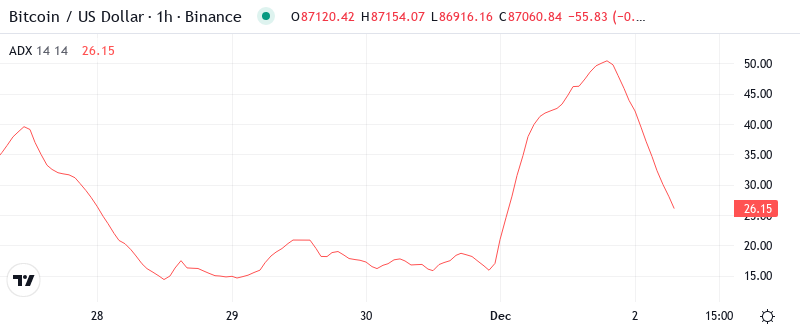
| ADX (Average Directional Index) | 40.0 |
| MACD (MACD Level) | -3776.43 |
| CCI (Commodity Channel Index, 20-period) | -74.64 |
RSI Drops to 34.96 – First Oversold Territory Since August Washout
With a breakneck bull run that took price over the upper Bollinger Band to print +150% gains in less than three months, a pullback was inevitable. Although a small bounce took place during the past week, it was quickly capped by the 10-day MA – one of the strongest in recent history. The almost relentless V-shaped recovery from the mid-September bottom provided no structure or support for prices on the way up and little resistance on the way down. Now, final destination support beckons in the .61-.67 zone, .382 Fibonacci retrace, and the top of the retracement channel.
What is interesting to note is how RSI reacted when Bitcoin revisited the mid-30s in the past: the oversold bounce following August’s drop led to a 40% rally within six weeks, while the comparable set-up in March resulted in a six-week consolidation phase. For swing traders, this oversold reading constitutes a high-probability bounce setup, but an explosive or an anemic bounce will likely foretell continuation or distribution, respectively, of the current downswing. The perpetual futures long-short ratio data, which points to accelerating long liquidations, indicates that such liquidation might need one more shakeout before a more enduring bottoming process can take place.
ADX at 40.03 Signals Mature Downtrend Nearing Exhaustion
The selloff screams fear with demand for protection against U.S. equity exposure ramping well past Brexit levels. Over the past month we have witnessed a spike in the CBOE Equity Put/Call ratio, taking it to levels not seen since Q4 of 2018. This ratio measures the volume of put options being traded relative to call options and there has historically been an overwhelming fear in the market after an extreme spike in put buying.
By observing the behavior of the past, it has been seen that extreme ADX readings over 40 are generally followed by a violent correction or a short consolidation period before the prevailing trend continues. When an oversold RSI is added to the already extreme ADX situation, the necessary conditions for a relief rally are in place. However, day traders should continue to face volatility, while the market continues to adapt to the CME volume movement from Bitcoin to Ethereum. Scalpers, therefore, may find better opportunities in strategies that move within a range, until ADX shows a value lower than 30, indicating that the phase of the trend is over.
20-Day EMA at $91.6K Becomes First Resistance After Support Failure
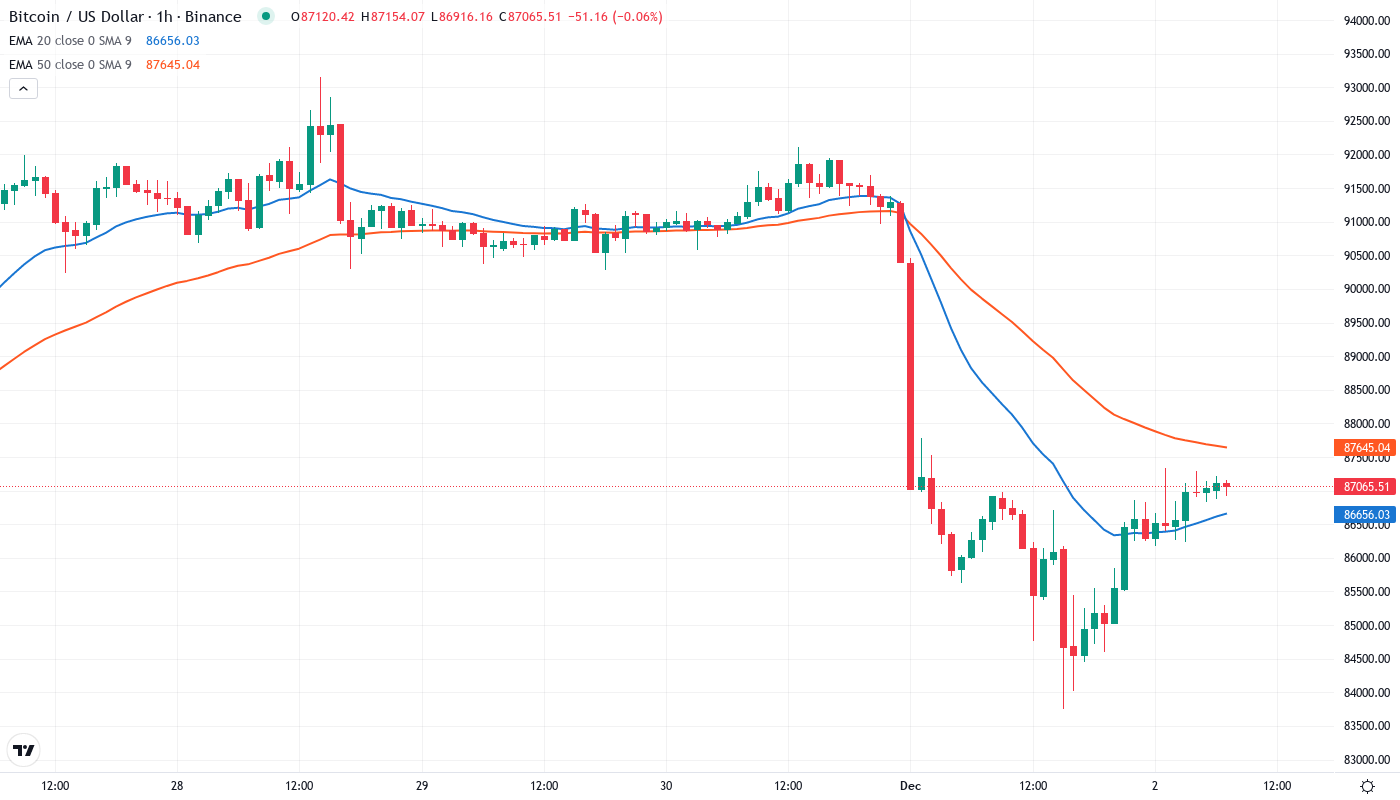
The EMA ribbons themselves are extremely tight but beginning a bearish expansion. After six days of stabilizing, the daily Keltner channel midpoint has been pushed below $90,000, and the upper 1.5% band has lifted to $97,000. This represents a trend break and the first confirmed secular lower low.
What bulls find most worrying, however, is the pinching together of the 50-day ($94.4K) and 100-day ($98.7K) EMAs, which will form a significant cluster of resistance that will take a good amount of volume to reclaim. The 200-day EMA is way off at $65.4K – a level that seems ridiculous at this point but which served as the support level for the last 30%+ correction. The former support zone of $91.6K now flips into a red line for the bears to defend on any relief bounce.
Support Stacks at $85.5K While Resistance Builds to $91.6K
There are resistance clusters formed between the monthly S1 pivot that is at $81.6K and the 20-day EMA that is at $91.6K. Hence, the zone between these two levels is likely to act as a stiff resistance. The $90K handle is part of this zone. As the longs who went long above $90K will be looking to liquidate their positions on a bounce to breakeven, this zone is likely to attract maximum selling. The volume profile of December points to huge trading volumes between $90K and $95K levels. This further strengthens the resistance in this zone. Additionally, the 20-day EMA has started to turn down and the RSI is in the negative territory, indicating that bears are in complete control. This could limit the pullback.
Bullish reversal from this level could instead push the market back to the $92.7K weekly pivot, which would bring former support turned resistance at the monthly pivot above back into focus as the next upside target. There would still be a lot of technical damage left to repair before attempting a retest of the ATH, though many traders would see a successful defense of this support line as a bullish signal and potential long entry.
Importantly, the market also presents a threaded needle pattern between $85.5K support and $91.6K resistance – a range more narrow than any witnessed since August. This pattern tends to resolve with a 15-20% directional move, and with both RSI oversold and ADX in a consolidated phase, the odds are skewed toward an upside resolution. The record short exposure seen perpetual futures data would be exacerbating a squeeze should support remain intact.
Bulls Need Decisive Close Above $91.6K to Reverse Bearish Structure
If the 20-day EMA continues to act as resistance, bears could attempt to retest the $85K support. Owing to this level being continuously front-run, stops could initially be targeted at $85.5K, but with a complete lack of latent buys below $85.5K, an overrun becomes likely. Should $85K give, a fast $5-6K decline could occur, as previously explained in “Blocking the Exits”.
If $85.5K support gives way on the next test, then expect a slide toward the monthly S2 at $76.9K, with a sharper and deeper washout increasingly likely given the relentless selling pressure from via extremes in CME discount and negative funding rates, which should persist if there’s a stronger bearish bias in the market profile.
Considering the oversold RSI, extreme ADX reading, and six successful defenses of $85.5K support, the most likely short-term trajectory is a relief bounce to test $91.6K resistance before the macro trend reasserts itself. Any such relief bounce will give more clarity on institutional positioning and the potential for rotation of flows to continue over the medium term.