Bitcoin Cash Surpasses $570 After Testing Key Support Six Times

Market Structure Shifts Higher
- BCH climbs 4.5% weekly after successfully defending $447 support
- Momentum oscillators reset from overbought extremes, creating room for continuation
- Bulls now guarding higher lows they have set by taking back the critical psychological price level
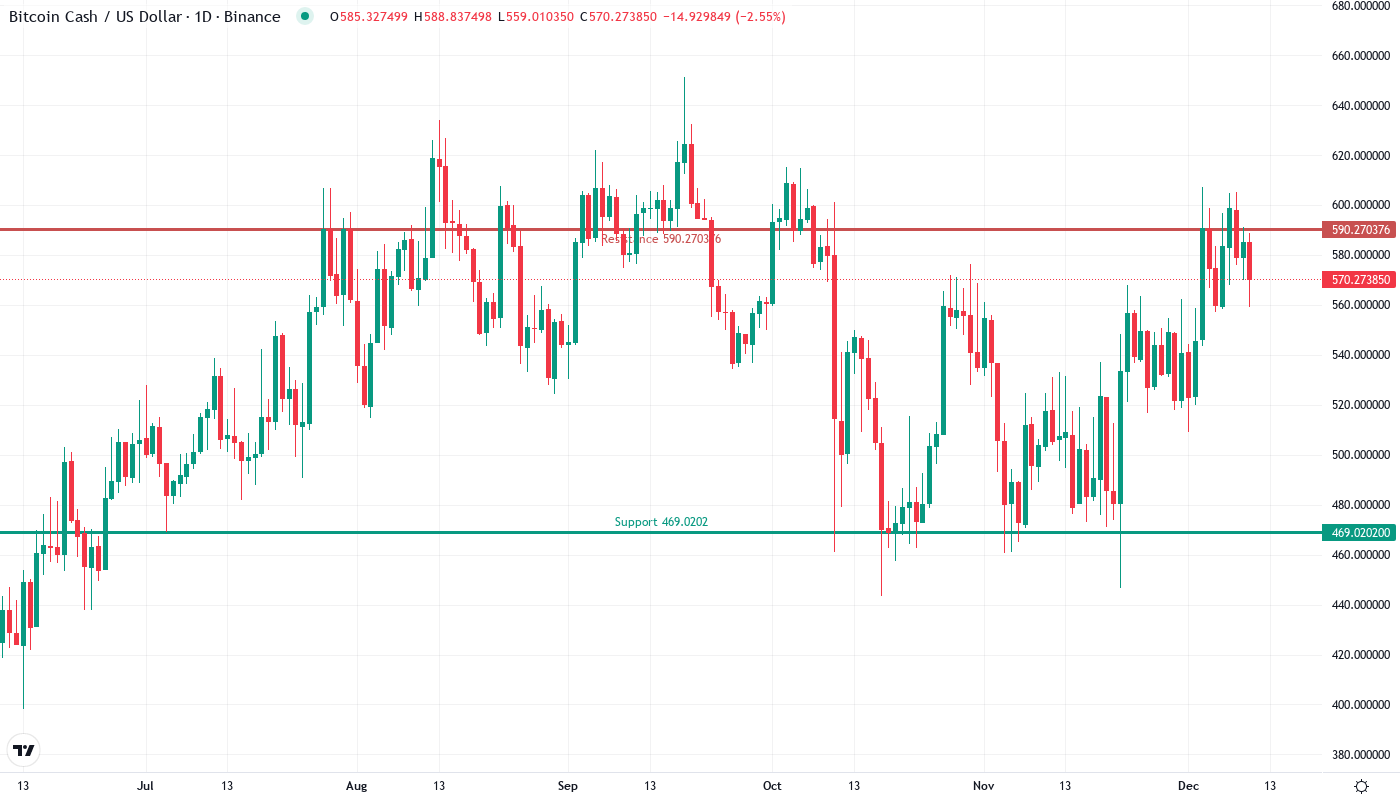
Bitcoin Cash has convincingly broken through the $570 resistance zone after a methodical 13.4% monthly surge that saw the cryptocurrency test and hold crucial support at $447 six times since early December. The move gains additional momentum from Bitwise’s $1.25 billion crypto index fund receiving SEC approval for exchange trading – a development that includes BCH in the fund composition and opens the door for increased institutional flows. The main question for traders is: can this breakout sustain above the psychological $600 level that has capped advances since November?
| Metric | Value |
|---|---|
| Asset | BITCOIN CASH (BCH) |
| Current Price | $570.88 |
| Weekly Performance | 4.52% |
| Monthly Performance | 13.42% |
| RSI (Relative Strength Index) | 54.4 |
| ADX (Average Directional Index) | 25.7 |
| MACD (MACD Level) | 16.94 |
| CCI (Commodity Channel Index, 20-period) | 60.63 |
RSI Drops From 74 Peak to Balanced 54 – Room to Run After Reset
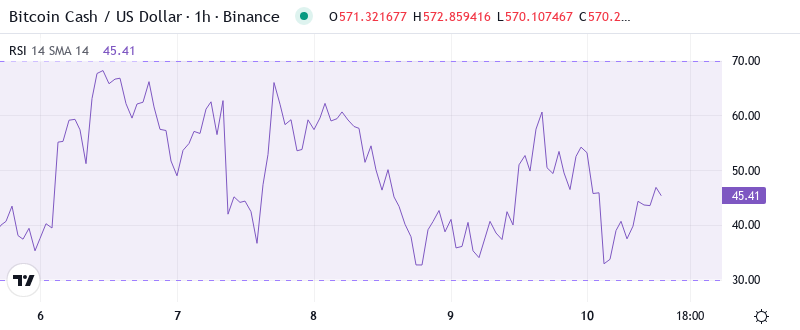
Reading the oscillator at 54.36 on the daily timeframe, traders see a textbook momentum reset that typically precedes the next leg higher. Just two weeks ago, RSI touched 74.54 – dangerously close to the extreme overbought territory that marked local tops in August and October. This pullback to neutral ground accomplished what bulls needed: it cooled off the overheated indicators without surrendering key price levels.
What’s revealing is how RSI behaved during the recent consolidation phase. Despite BCH retracing from $607 to test $447 support, the oscillator never dipped below 48.81 on the weekly timeframe – a sign that selling pressure remained measured rather than panicked. Similar RSI configurations in September preceded the rally from $320 to $520, suggesting the current setup favors continuation rather than reversal. So for swing traders, this balanced RSI reading at 54 means entries remain attractive as long as BCH holds above $540.
ADX at 25.7 Signals Shift From Chop to Trending Conditions
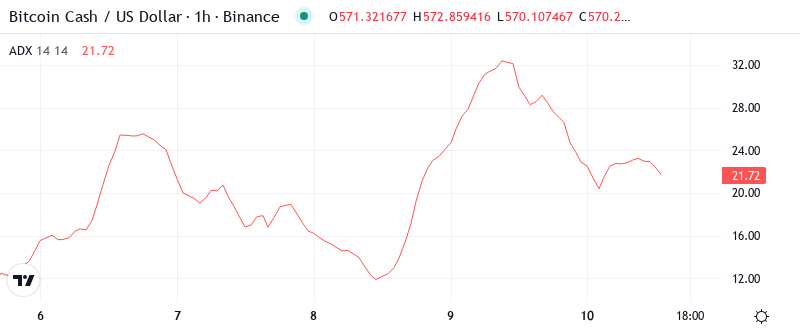
Trend strength just crossed the magic threshold. ADX reads 25.73, marking a decisive shift from the sub-20 readings that kept BCH range-bound through most of December. Basically, being in this zone means the market is transitioning from a trader’s nightmare of choppy sideways action into a trend follower’s paradise where directional moves gain momentum.
Since ADX climbed from the mid-teens last week, price action has become increasingly directional – first with the surge to $607, then the organized pullback to support, and now the renewed push above $570. To clarify, the ADX is indicating that we are switching from boundary conditions to a trending state where breakouts have higher probability of follow-through. Therefore, day traders should suit their strategies to this change by favoring momentum plays over mean reversion setups, especially with institutional interest via the Bitwise fund potentially adding sustained buying pressure.
20-Day EMA at $556 Becomes Support After Three Rejection Attempts
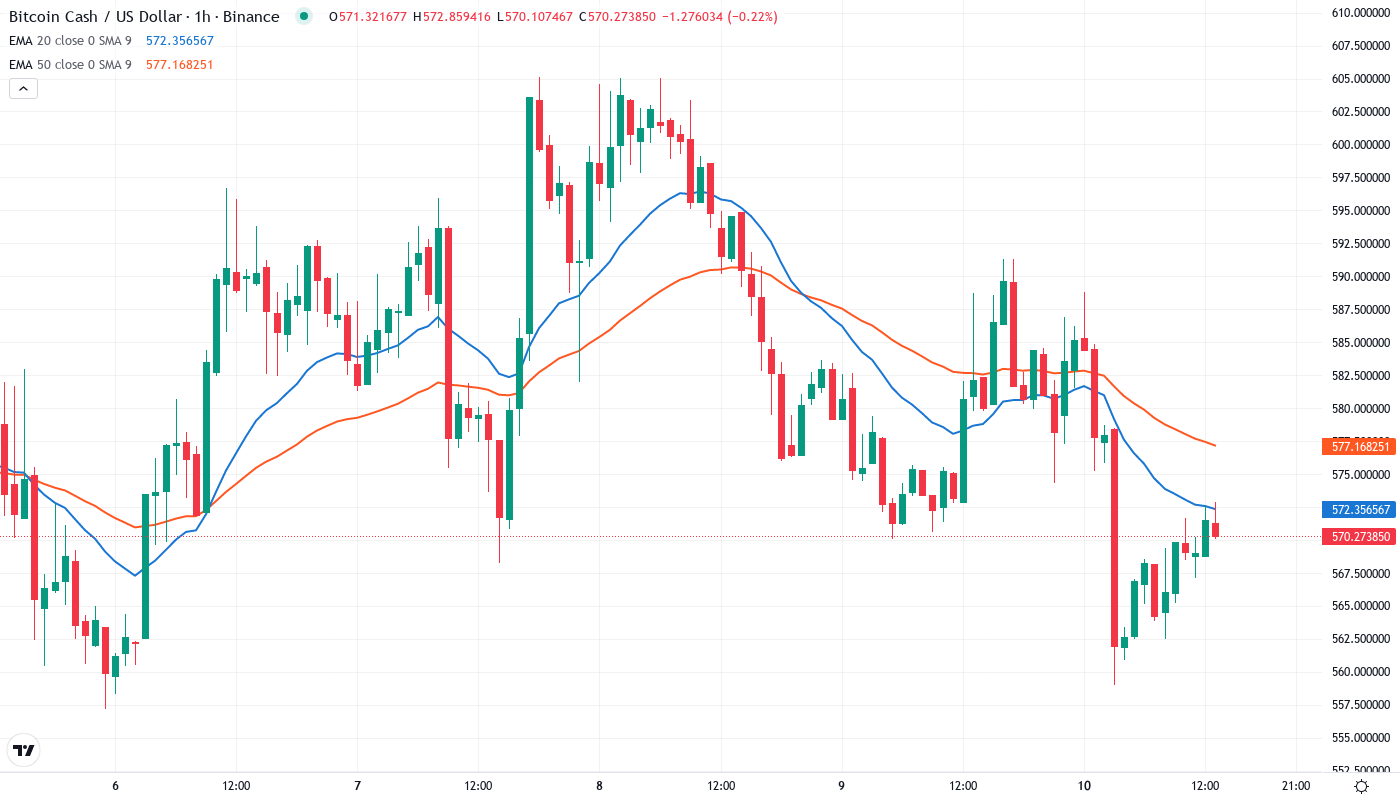
Price action tells a clear story through the EMA ribbons. BCH is positioned above the 10-day ($570.65), 20-day ($556.33), and more importantly, the 50-day EMA at $540.97 – a configuration that hasn’t held this cleanly since the November rally topped out. The 20-day EMA in particular has transformed from stubborn resistance that rejected advances three times in early January to now acting as dynamic support during pullbacks.
Looking at the broader moving average structure, the setup gets even more constructive. The 100-day EMA sits at $536.31, providing a deeper safety net, while the 200-day EMA at $515.14 marks the line in the sand for the larger uptrend. That former resistance area at $556 now transforms into a red line for the bulls to hold – lose it, and the whole breakout narrative comes into question. The compression between these averages also suggests a larger move brewing, with the weekly EMAs painting an even more bullish picture as price trades above all major long-term averages.
Resistance Stacks Between $590 and $639 While Support Builds at $518
Above current price, sellers have stacked their defenses in two distinct zones. The immediate resistance runs from $590.27 to $607.35 – essentially the December highs that need to be conquered for any sustainable rally. Beyond that lies the more formidable barrier between $639.76 and $697.48, where both psychological round numbers and technical pivot points converge. The Bitwise fund approval could provide the catalyst to attack these levels as new institutional money seeks exposure.
Bulls defend multiple support layers that have proven their worth through repeated tests. The $518.51 level has emerged as the most critical floor, holding firm during six separate attempts to break lower since December. This isn’t just random price action – it’s where the monthly pivot at $518.51 aligns with horizontal support from November’s breakout point, creating a confluence that bears have failed to crack despite multiple attempts.
Crucially, the price architecture shows buyers gaining confidence with each successful defense of support. The pattern of higher lows from $447 to $488 to $518 resembles a coiled spring, with each compression adding potential energy for the next expansion. This structure signals buyer’s power as long as they can keep $540 above in any kind of retracement – a level that coincides with both the 50-day EMA and psychological round number support.
Bulls Need Conviction Close Above $607 to Target $639
Should price reclaim and hold above $607 with conviction, the path opens toward the $639-$697 resistance cluster. Bulls must secure a close that reaffirms the December high breakout and then target $639.76 while the Bitwise fund inclusion provides the necessary ongoing catalyst. The measured move from the $447-$607 range projects to roughly $650, aligning with the monthly R1 pivot at $639.76.
The setup fails if BCH drops below $540 on volume and cannot immediately recover. The bearish domino falls in the event that price hard rejects at $590 resistance and breaks under the $556 20-day EMA – this would trap recent buyers who entered on the fund news, and prices would likely flush toward $518 or even $488 to reset positioning. Watch for ADX to drop below 20 as an early warning signal of trend exhaustion.
Given the technical configuration and fundamental backdrop of increased institutional access, the most likely short-term path sees BCH consolidating between $556-$590 before attempting another assault on the December highs. The combination of reset momentum indicators, trending market conditions, and fresh capital flows suggests patience will be rewarded as long as support at $540 holds firm.