Bitcoin Cash Surges Past $590 as Momentum Indicators Flash Buy Signals

Market Pulse
- BCH convincingly broke above the 50-day EMA at $538, flipping former resistance into support
- ADX climbs through 25, signaling shift from choppy consolidation to trending conditions
- Monthly performance of +15.8% makes Bitcoin Cash the strongest major L1 blockchain in early 2025
Bitcoin Cash has kick-started 2025 with a devastating surge, climbing 15.8% over the past month to trade at $593 – a move that positions BCH as the top-performing major layer-1 blockchain according to recent market data. The rally gained serious momentum after breaking above the psychological $550 level, with BCH now trading comfortably above all major moving averages for the first time since early December. The main question for traders is: can this breakout sustain itself above the newly-flipped 50-day EMA support, or will profit-taking emerge near the monthly high of $607?
| Metric | Value |
|---|---|
| Asset | BITCOIN CASH (BCH) |
| Current Price | $593.33 |
| Weekly Performance | 9.70% |
| Monthly Performance | 15.79% |
| RSI (Relative Strength Index) | 59.5 |
| ADX (Average Directional Index) | 25.1 |
| MACD (MACD Level) | 18.71 |
| CCI (Commodity Channel Index, 20-period) | 148.81 |
RSI at 58 Signals Balanced Momentum After December’s Oversold Reset
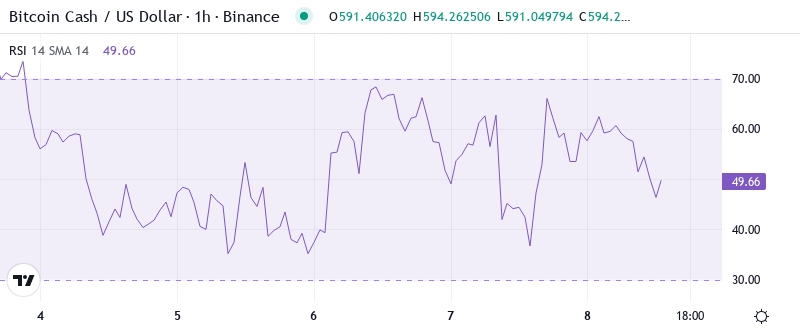
RSI sits at 58.00 on the daily timeframe, marking a healthy recovery from the oversold conditions that plagued BCH throughout December. This balanced reading leaves room for continuation in either direction – neither overbought nor oversold, the oscillator suggests the recent 40% surge hasn’t exhausted buying pressure yet. What’s particularly revealing is how RSI maintained above 50 throughout the consolidation phase, never surrendering the neutral line despite price chopping sideways.
Similar RSI configurations in September preceded BCH’s run to $600, though that rally stalled once the oscillator pushed into overbought territory above 70. So for swing traders, this mid-range RSI reading combined with BCH’s market-leading performance creates an interesting setup – there’s fuel in the tank for higher prices, but the oscillator warns against chasing extended moves without pullbacks to support.
ADX Breaks Above 25 as Bitcoin Cash Shifts From Range to Trend
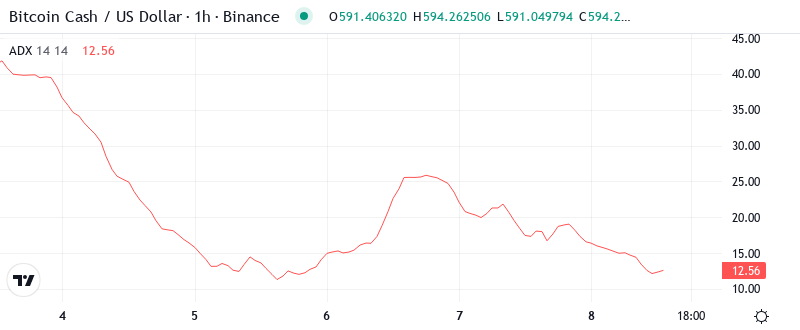
Looking at trend strength indicators, the ADX reading of 25.12 marks a critical shift in market character. After spending weeks below 20 in classic range-bound conditions, this climb above the 25 threshold signals genuine directional movement is emerging. Basically, the market is transitioning from the choppy, directionless action that frustrated traders in December to a more tradeable trending environment.
The +DI dominance at 22.23 versus -DI at 9.33 confirms buyers control the tape. To clarify, this isn’t just a relief bounce – it’s the beginning of what ADX suggests could be a sustained move. Therefore, trend-following strategies that would have been chopped up during the consolidation phase now have a better probability of success as BCH establishes its new uptrend structure.
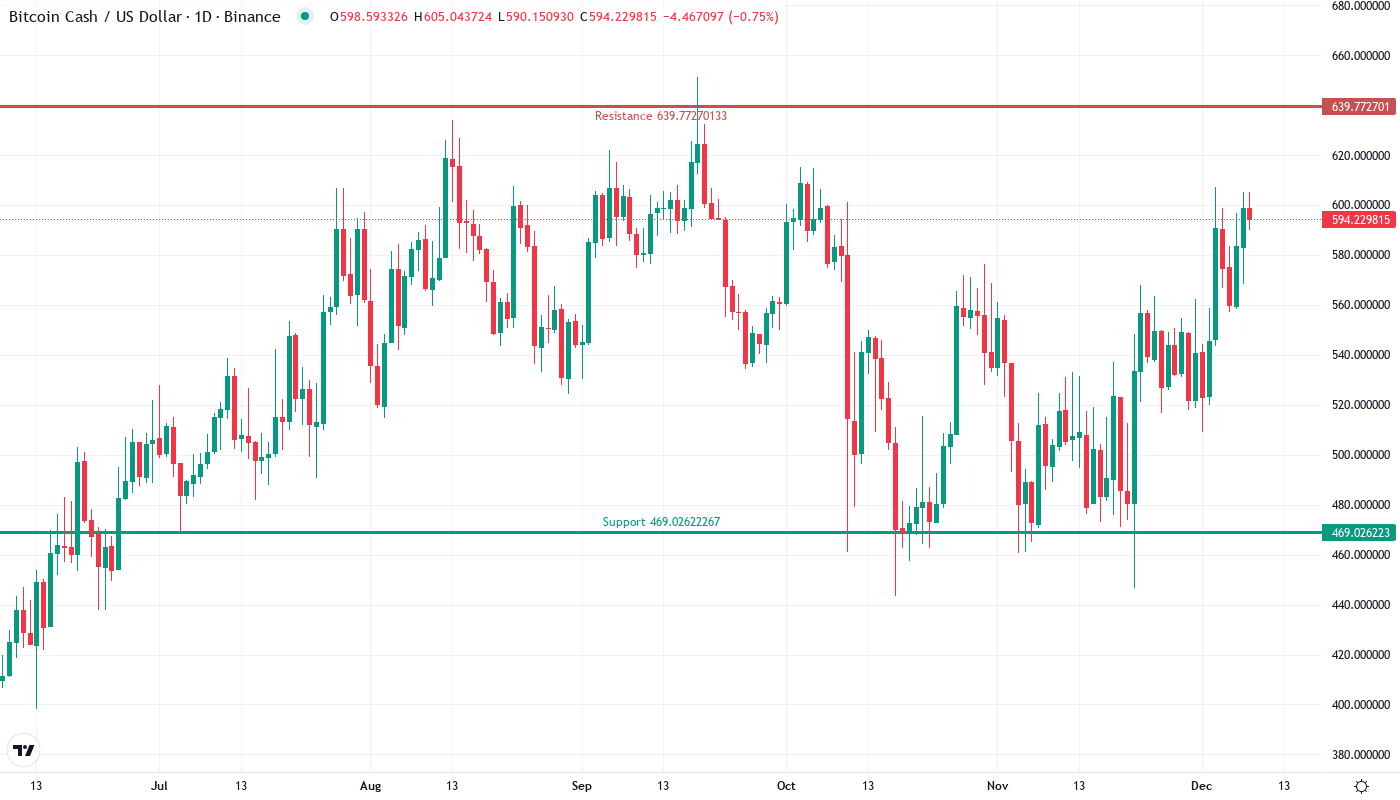
50-Day EMA at $538 Transforms From Resistance to Critical Support
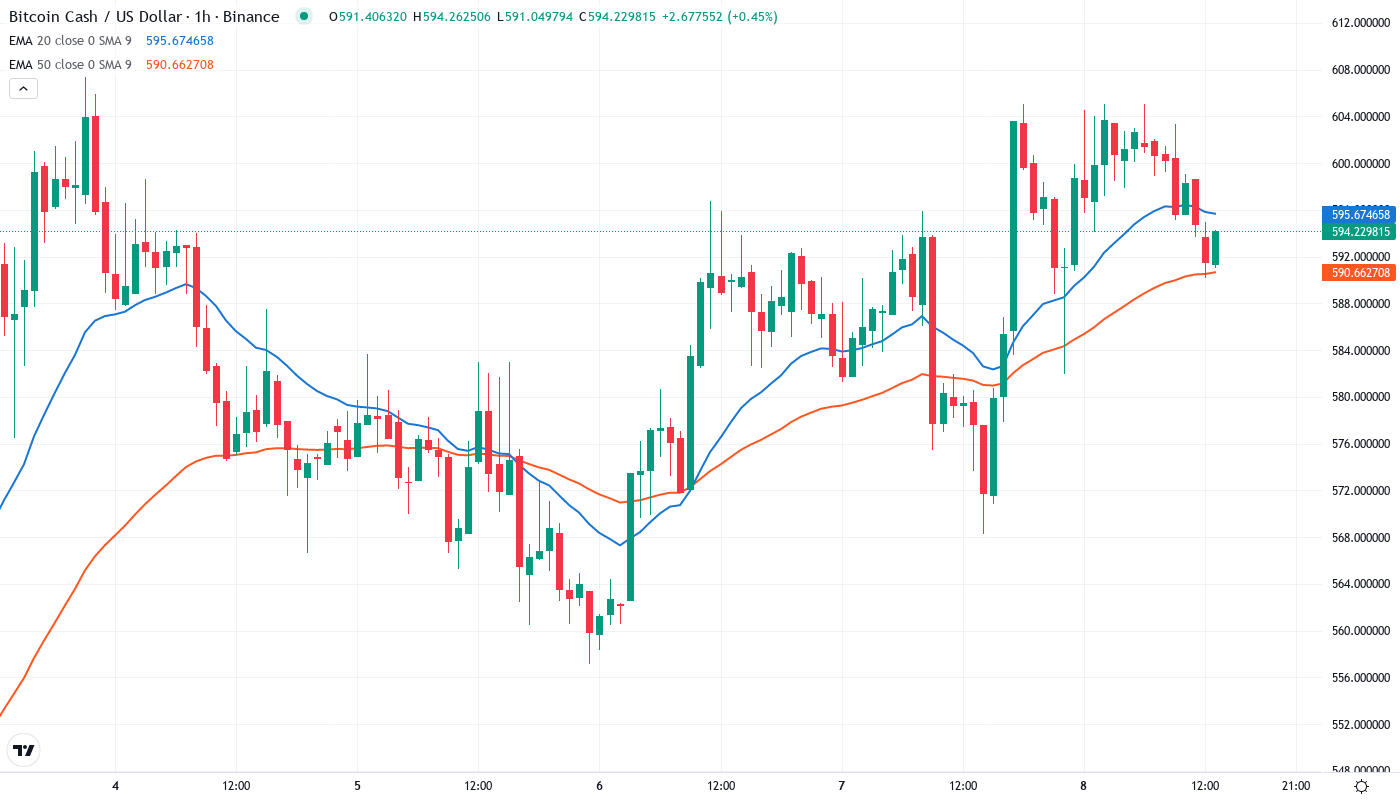
Price action through the EMA ribbons tells a compelling story of structural improvement. BCH trades decisively above the 10-day ($570), 20-day ($553), and most importantly, the 50-day EMA at $538 – a level that rejected advances three times in December before finally breaking. The 100-day EMA sits lower at $534, providing additional support layers, while the 200-day EMA at $514 offers a distant safety net for any deeper retracements.
What’s significant is the compression between the 20-day and 50-day EMAs throughout late December, resembling a coiled spring that’s now released to the upside. That former resistance area at $538 now transforms into a red line for the bulls to hold – any daily close below would suggest the breakout is failing. The clean air above to the monthly high at $607 presents the next magnetic target for momentum traders.
Resistance Clusters Between $607-$639 While Support Stacks at $538
The immediate resistance zone spans from the monthly high at $607 to the weekly Fibonacci R3 at $639, where sellers defended aggressively in previous attempts. This $32 range represents the first major test for the current rally, especially given BCH’s 40% surge positioning it as the strongest major L1 – a status that could attract profit-taking from early buyers.
Support architecture looks increasingly robust after this week’s surge. The $538 level (50-day EMA) stands as the first line of defense, reinforced by the psychological $550 zone that attracted buyers throughout December. Below that, the $514 area offers confluence between the 200-day EMA and monthly pivot point – a level that’s held firm since November.
Market structure clearly favors bulls as long as they defend $538 on any retracement. The fact that BCH leads all major L1s in performance while maintaining this technical setup suggests institutional accumulation may be driving the move, particularly as the broader crypto market shows signs of renewed risk appetite entering 2025.
Bulls Target $639 While Bears Need Break Below $538 to Regain Control
Bulls must secure a daily close above $607 to confirm the next leg higher, targeting the $639 Fibonacci extension where weekly R3 resistance waits. With BCH’s status as 2025’s top-performing L1 blockchain providing fundamental momentum, sustained buying above the monthly high could trigger a measured move toward $650-$675.
The bearish scenario activates if BCH fails at $607 and drops below $538 support with conviction – this would trap recent breakout buyers and likely flush positions down to $514. A decisive break of the 50-day EMA would signal the January rally was merely an oversold bounce rather than genuine trend change, reopening downside to December’s range.
Given BCH’s relative strength leadership and the technical breakout above key moving averages, the most probable near-term path sees consolidation between $580-$607 as the market digests recent gains before attempting another push toward $639. The combination of balanced momentum readings and strengthening trend metrics supports higher prices, but traders should respect the monthly high as a natural profit-taking zone.