Bitcoin Cash Surges 51% in Monthly Rally as Bulls Eye $600 Resistance

Market Structure Shifts Higher
- Bitcoin Cash (BCH) has broken above the 50-day EMA at $528, where former resistance has now turned into support
- The rally is accompanied by a surge in volume, which validates the trend and suggests that the solid foundation at $450 is strengthening the uptrend
- After reclaiming the crucial $500 psychological level, the bulls are now protecting higher lows
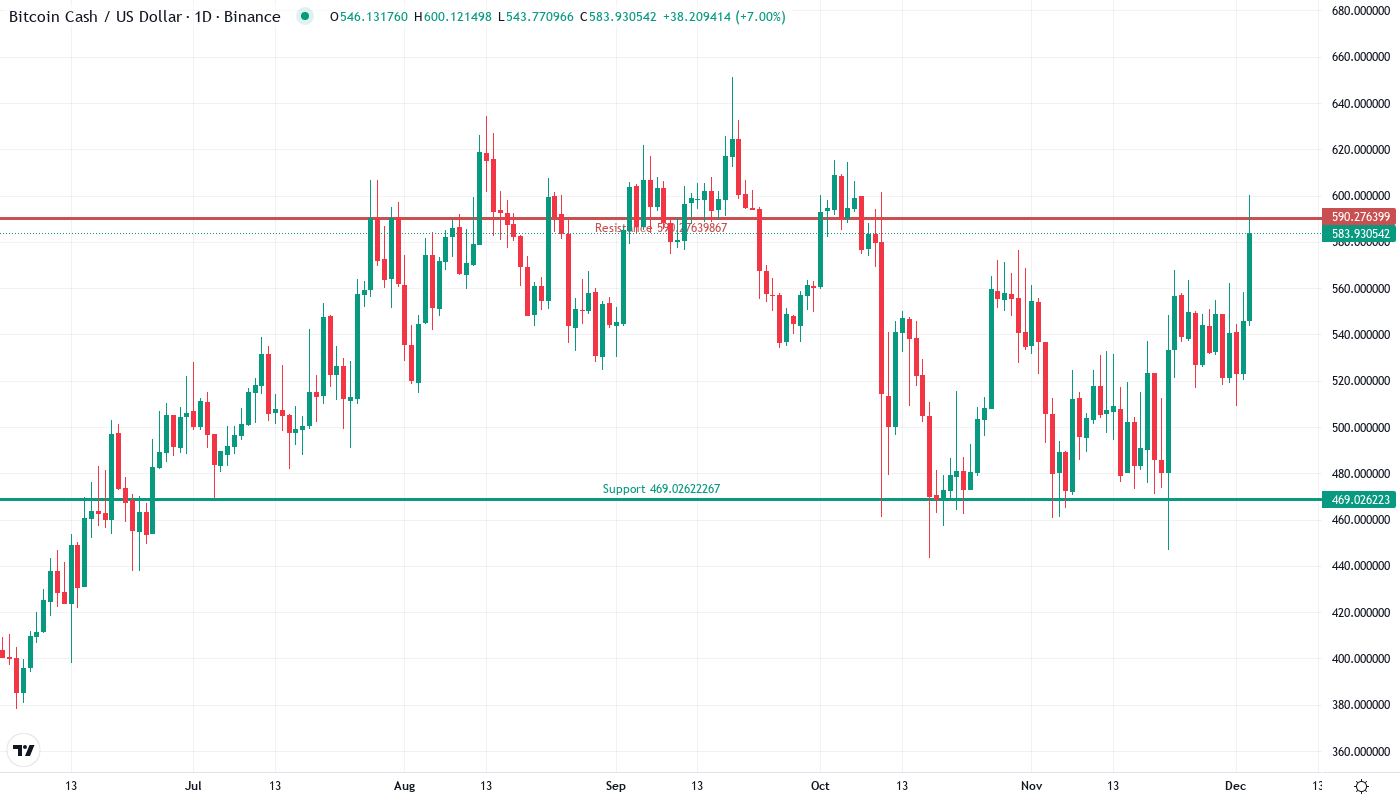
Bitcoin Cash started a strong bullish wave uptrend and has increased by 51.29% in the last month, hitting $582.92 – the highest level in months. The advance accelerated after BCH breached several resistance barriers that had contained the price for months, with the breakout volume spike indicating the move is real. The key question for traders is whether the bulls can hold the newly regained $528 level and push the price towards $600 or whether profit-takers will close the next leg first pullback?
| Metric | Value |
|---|---|
| Asset | BITCOIN CASH (BCH) |
| Current Price | $582.92 |
| Weekly Performance | 10.51% |
| Monthly Performance | 8.61% |
| RSI (Relative Strength Index) | 60.2 |
| ADX (Average Directional Index) | 18.9 |
| MACD (MACD Level) | 10.29 |
| CCI (Commodity Channel Index, 20-period) | 157.03 |
RSI at 60.97 Shows Room for Continuation Without Overheating
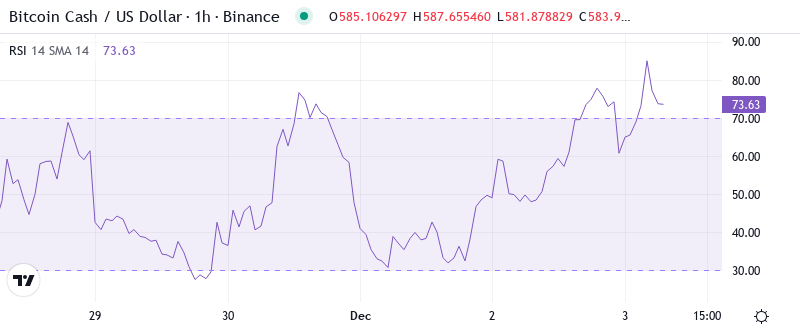
The relative strength index measures the speed and change of price movements. RSI readings range from 0 to 100. Traditionally, and according to Wilder, RSI is considered overbought when above 70 and oversold when below 30.
Therefore, those who engage in swing trading could not have asked for a better setup which appears to be a follow-through type of play. The breakout news, coupled with the abnormally high volume, correlates nicely with the momentum indicator insinuating that this was institutional buying and not retail FOMO. When it comes to the bulls, they will be looking for RSI to maintain above 50 on any pullback to keep the uptrend intact.
ADX Climbs to 18.89 – Trend Building From Compression
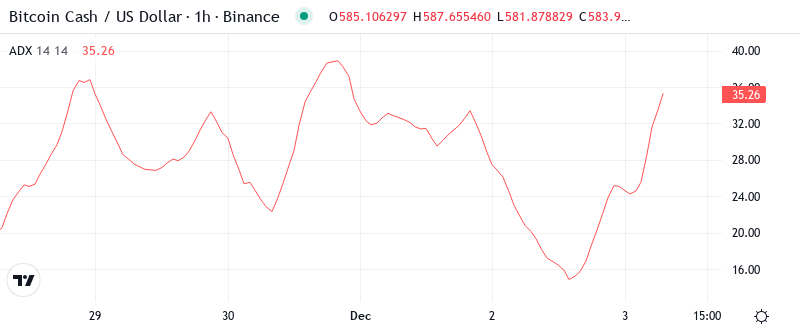
With an ADX now promising more robust directional action in the coming weeks, it will be interesting to see if this new positive growth can continue, as the network appears to be thriving post-halving and with new institutional inflows. Most of which seem to be net positives from an operational and speed standpoint.
In essence, day traders will want to switch to strategies appropriate for a trending environment. For instance, the rising ADX and breakout volume surge indicate that this is likely the beginning of a real move as opposed to just another false breakout. The ADX indicates that momentum is present but not to an extreme level, making it perfect for trend followers.
50-Day EMA at $528 Becomes Critical Support After Three-Month Resistance
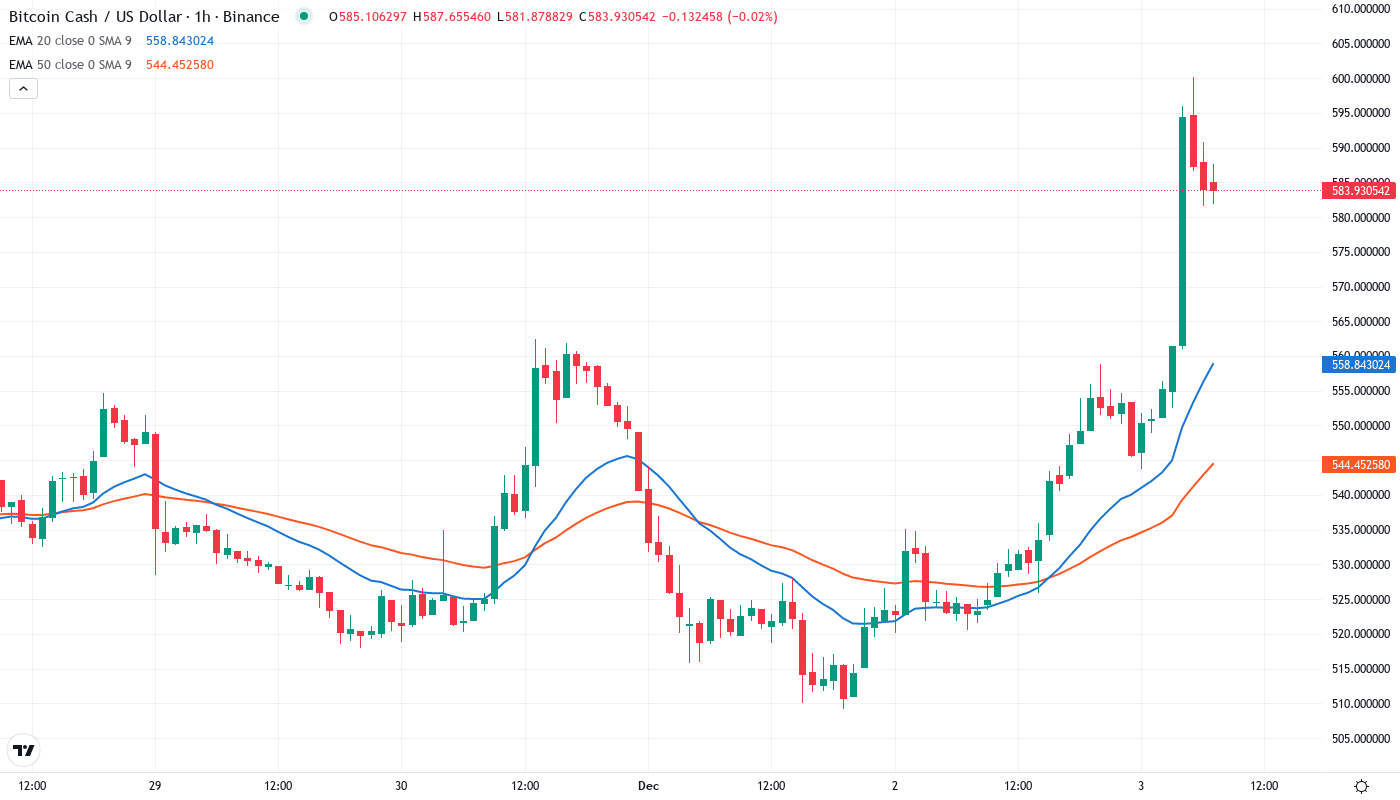
The Price action through the EMA ribbons speaks for itself. BCHUSD is above the 10-day ($542), 20-day ($532) and, most importantly, the 50-day EMA ($528), which has previously sent price back on three separate occasions since August. The last time the 50-day EMA was broken, the retest failed to clear, resulting in further downside. This time, the resistance turned support flip is as clean as it gets.
What provides a glimpse of hope is that, unlike the surge into Q4 where price marched into a heavy resistance wall with little support below, the scaling process pulled up enough anchors to potentially create some isolated support structures for market makers to leverage. This doesn’t mean they will, however. If the macro $528-532 resistance gives way, the short-term $515-518 level should provide some near-term cover as it also sees the daily middle band showing up – similar to how the 100-day EMA supported pric…
Resistance Stacks Between $590-600 as December Highs Loom
Sellers have built up this area. We faced strong resistance in the $590-600 vicinity, with December’s highs in the $590s and the psychological $600 level. Additionally, the monthly pivot R1 was about $590.28. So, we had triple confluence. Volume profiles showed that this was a point of control with a lot of volume on the offer on the way up.
Bulls are protecting several support barriers due to the rally seen this month. The initial support area is seen between $528 (50-day EMA) and $532 (20-day EMA) with the next major cushion located at the 200-day EMA around $510. We would like to highlight that BCH has rebounded on six occasions from the $450- $460 zone earlier before the breakout, which helped solidify the uptrend.
The current market structure shows a textbook continuation pattern following the bullish breakout. This suggests that buyers are in the driving seat as long as they defend $528 during a retracement. With Mt. Gox creditors given a deadline of 2026, a significant overhang has been removed from the broader crypto market, and BCH can concentrate on its technicals.
Bulls Target $639 Monthly Pivot While Bears Guard $528 Support Flip
If BCH can manage to secure a daily close above $600, which I think is probable with all the end of August excitement, it would confirm a breakout from the bull flag on the daily chart. The opening of this month was highly influenced by this news.
It is important to note that bears regain control of the price action only if there is a break back below the $528 support cluster. And not just that, but the break must also come with a significantly higher than average volume. The move below the $528 would likely trap the breakout buyers and lead to the triggering of the sell-stops that are currently sitting at $510. Should this happen, half of the previous monthly gain would likely be erased. The setup is invalidated entirely below $500 however if the price action reconnects back above that level the previous ranging environment is to be expected.
Considering the technical setup and diminishing Mt. Gox worries, the likely short-term scenario is for BCH to consolidate in the $560-590 range and then try to break through the $600 price point. An increasing ADX, a steady RSI, and a confirmed support/resistance flip make it easier for bulls to take the lead and control the risk since these levels are easy to determine.