Bitcoin Cash Surges 40% to Lead Major L1s as Momentum Builds

Market Structure Shifts Higher
- BCH climbs 33.9% monthly, outpacing all major layer-1 blockchains in early 2025
- Momentum reset from overbought territory positions coin for next leg higher
- Support architecture builds from $514 to $397 with multiple confluence zones
Bitcoin Cash darted through resistance barriers this month, posting a 33.9% gain that established it as the leading performer among major layer-1 blockchains in 2025. The surge from December’s $431 base to current levels near $574 came as institutional interest in the broader crypto market intensified, with National Bank of Canada’s MicroStrategy investment signaling renewed confidence. The main question for traders is: Can BCH sustain this momentum above the newly-flipped support at $514, or will profit-taking trigger a deeper retracement to test lower support zones?
| Metric | Value |
|---|---|
| Asset | BITCOIN CASH (BCH) |
| Current Price | $574.22 |
| Weekly Performance | 9.74% |
| Monthly Performance | 15.89% |
| RSI (Relative Strength Index) | 55.4 |
| ADX (Average Directional Index) | 25.9 |
| MACD (MACD Level) | 17.12 |
| CCI (Commodity Channel Index, 20-period) | 81.20 |
RSI Cools From 76 Peak Without Capitulation Signal
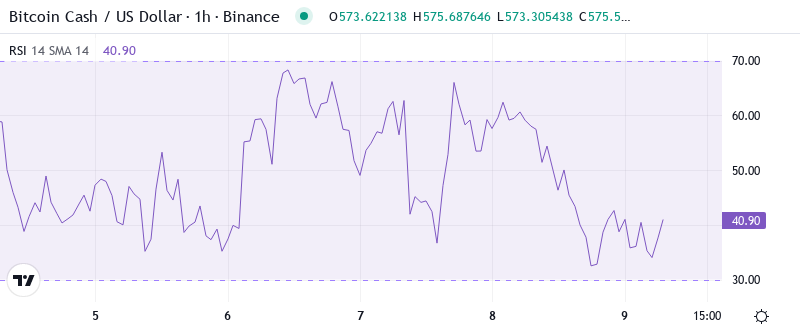
Reading the oscillator at 55.17 on the daily timeframe, momentum has cooled from last week’s overbought extreme of 76.56 without triggering any capitulation signals. This controlled pullback mirrors the pattern from September, when RSI retreated from similar heights before BCH launched its next 25% leg higher. The weekly RSI still holds comfortably at 60.52, suggesting the longer timeframe remains far from exhausted.
So for swing traders, this balanced daily RSI creates an ideal re-entry zone – not too hot that you’re chasing, not so cold that the trend has broken.
Historically, BCH’s strongest rallies have featured these mid-cycle momentum resets where RSI drops from overbought territory back to the 50-60 range before the next thrust higher materializes. The fact that BCH leads all L1s in 2025 performance while resetting momentum adds wind to the sails for continuation.
ADX at 25.85 Confirms Shift From Consolidation to Trending Market
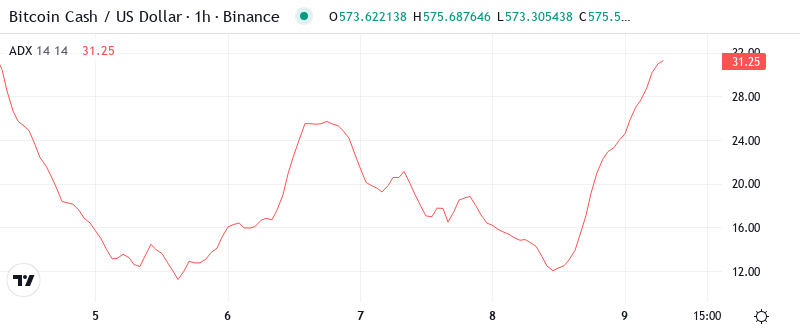
At the level of 25.85, the ADX reading indicates we’ve crossed the threshold from choppy range-bound conditions into a genuine trending environment. This shift occurred precisely as BCH broke above $514 resistance, with directional movement now favoring bulls as evidenced by the +DI dominance. Basically, being in this zone means trend-following strategies start to outperform mean reversion setups.
To clarify, the ADX climb from December’s sub-20 readings to current levels marks BCH’s transition from a grinding consolidation phase to directional price discovery. Day traders should adjust their approaches accordingly – tight ranges and quick scalps give way to riding momentum with trailing stops. The last time ADX sustained readings above 25 for multiple weeks, BCH rallied from $380 to $607 in under two months.
20-Day EMA at $553 Flips From Resistance to Critical Support
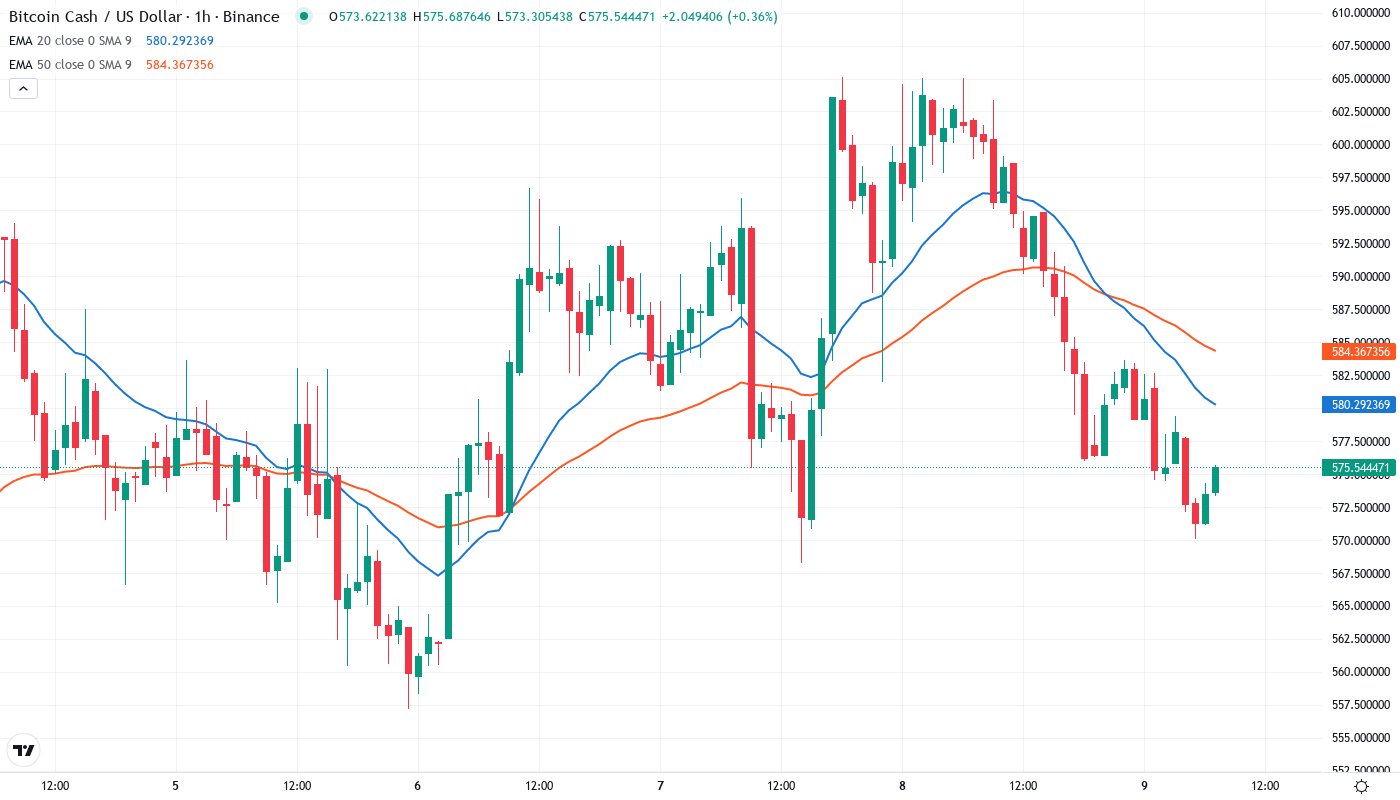
Price action tells a clear story through the EMA ribbons. BCH currently trades above the 10-day ($568), but more crucially, the 20-day EMA at $553 just flipped from resistance to support after three failed attempts in December. This level now represents the red line for bulls to hold – any daily close below would signal the first real crack in the uptrend structure.
What’s particularly revealing is the compression between the 50-day ($539) and 100-day ($535) EMAs below current price. This tight cluster around $535-540 creates a formidable support zone that coincides with December’s breakout point. The 200-day EMA sits distant at $514, providing a final safety net that hasn’t been tested since the rally began. Bulls defended this confluence aggressively during last week’s pullback, absorbing selling pressure without allowing a deeper retracement.
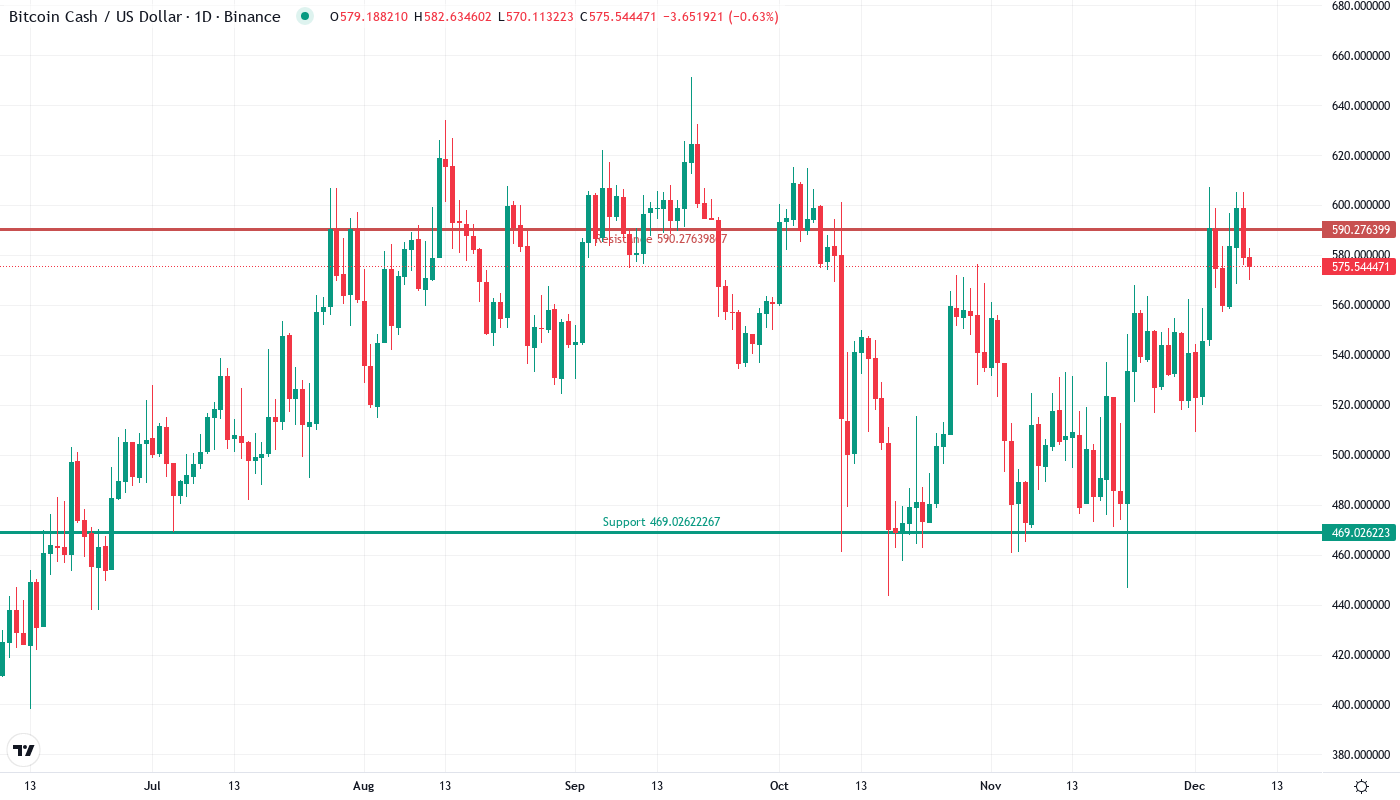
Resistance Stacks Between $590-$607 While Support Layers Build Below
The immediate resistance zone spans from $590 to December’s high at $607, where profit-taking emerged last week. Above that, the psychological $650 level looms as the next major target, representing a 13% move from current levels. Monthly pivot calculations place R1 resistance at $639, adding another layer to navigate.
Support architecture looks increasingly robust after this week’s successful defense of the $553 zone. The first support sits at the 20-day EMA ($553), followed by the compressed 50/100-day EMAs around $535-540. December’s breakout level at $514 now acts as major structural support, reinforced by the 200-day EMA at the same level.
This configuration creates clear risk-reward parameters – bulls have roughly $20 of immediate downside risk to the first support versus $76 of upside potential to the $650 target. The market structure favors buyers as long as they defend the $514-520 zone on any deeper retracement. Volume patterns during the recent pullback showed accumulation rather than distribution, with BCH’s leadership position among L1s attracting fresh capital.
Bulls Target $650 as BCH Leads Layer-1 Recovery Rally
Bulls need a decisive daily close above $607 to confirm the next leg higher, targeting the psychological $650 level where monthly R2 resistance waits. The combination of BCH’s performance leadership and institutional flows entering crypto through vehicles like MicroStrategy provides the fundamental backdrop for continuation. Should momentum accelerate, the measured move from December’s base points to $680.
The bearish scenario activates if price fails to hold the 20-day EMA at $553 on a daily close, potentially triggering a cascade to the $514-520 support cluster. A breakdown below $514 would trap recent buyers and likely flush positions down to $467, where the 200-week EMA provides distant support. This would erase most of January’s gains and reset the technical structure.
Given BCH’s momentum leadership, successful defense of nearby support, and the ADX confirmation of trending conditions, the most probable path sees consolidation between $553-$590 before another attempt at December highs. The reset in daily RSI from overbought to neutral creates room for the next thrust higher, while weekly indicators remain constructive for continuation of the broader uptrend.