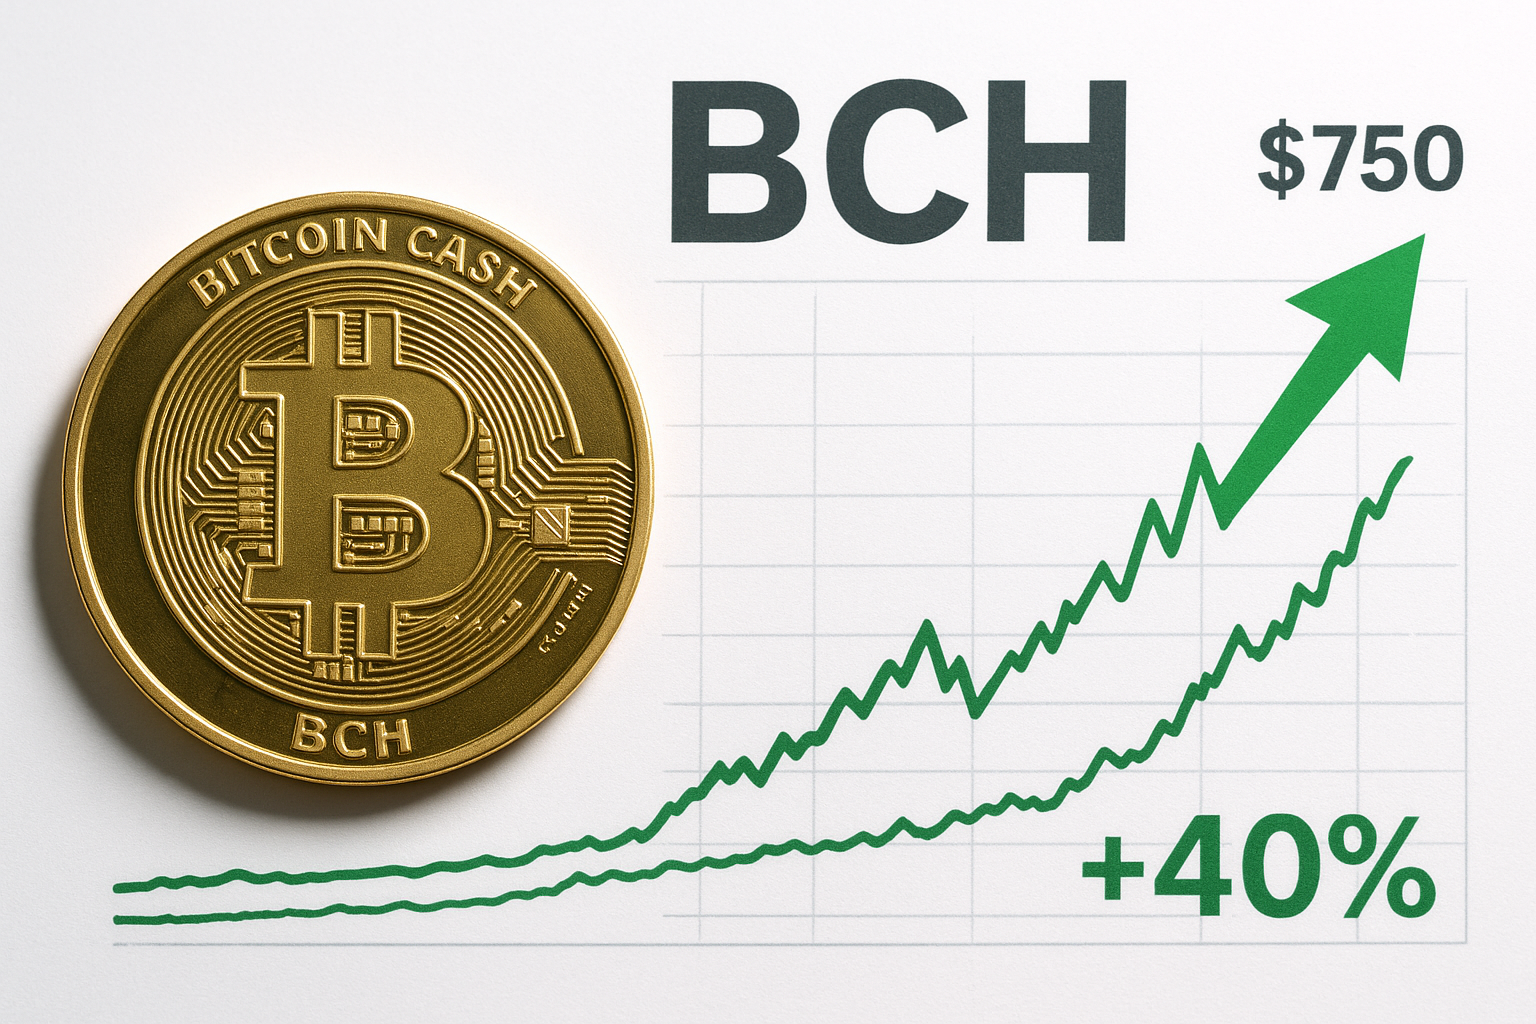
Bitcoin Cash Surges 40% to Lead Major L1s as Bulls Eye $750 Resistance
Market Structure Shifts Higher
- BCH rockets 37% month-to-date, outpacing all major Layer-1 protocols
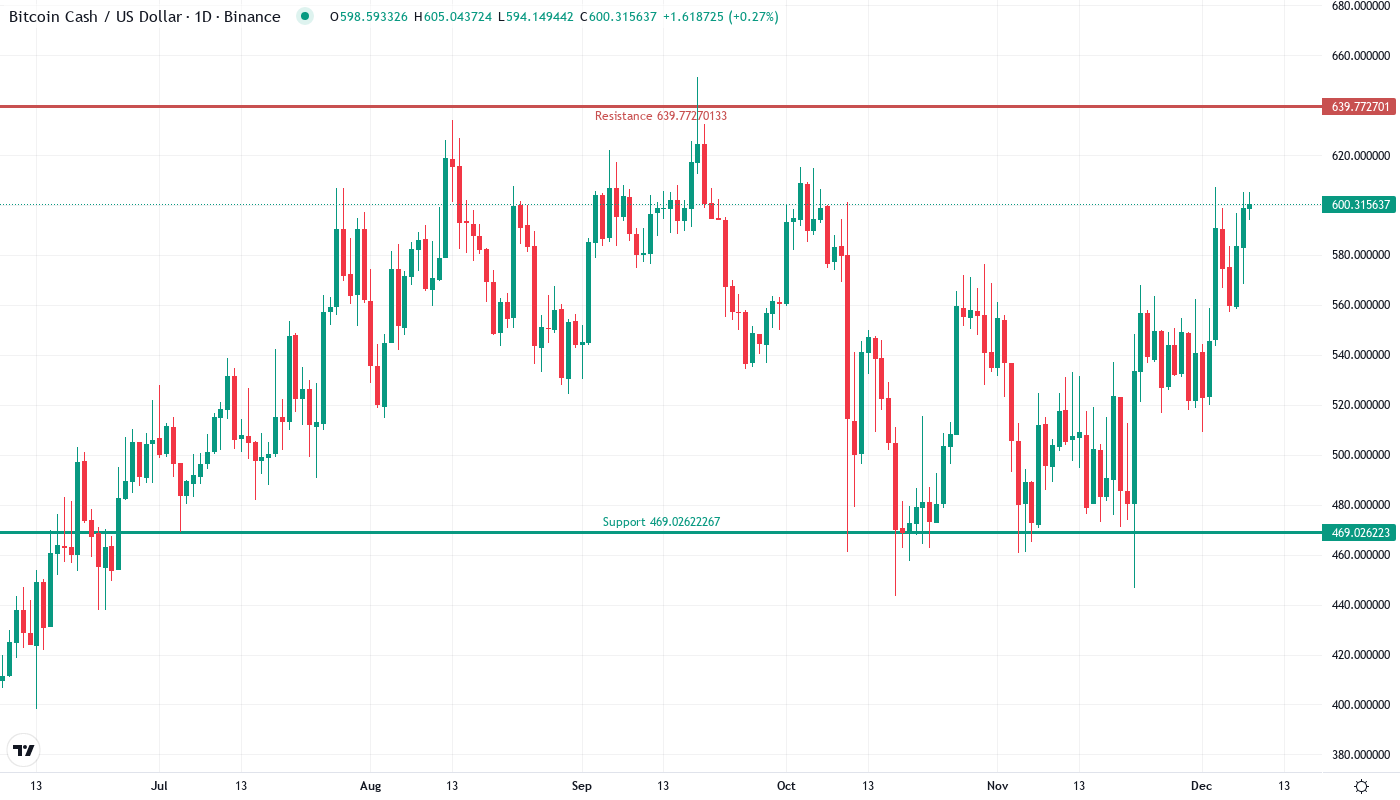
- Six-time tested support at $470 transforms into launching pad for rally
- ADX climbs through 25 threshold, confirming shift from chop to trending conditions
Bitcoin Cash has darted through multiple resistance levels this week, climbing 17.2% over seven days and an impressive 37.1% for the month as the market digests news of BCH leading all major L1s in 2025 performance. The rally marks a decisive shift from December’s consolidation phase, with price action convincingly breaking above the psychological $600 level that capped advances three times since November. The main question for traders is: can this momentum sustain through the heavy resistance stacking between current levels and the $750 target zone?
| Metric | Value |
|---|---|
| Asset | BITCOIN CASH (BCH) |
| Current Price | $600.36 |
| Weekly Performance | 11.00% |
| Monthly Performance | 17.16% |
| RSI (Relative Strength Index) | 61.0 |
| ADX (Average Directional Index) | 25.1 |
| MACD (MACD Level) | 19.27 |
| CCI (Commodity Channel Index, 20-period) | 157.63 |
Momentum Resets to 57.3 After December’s Oversold Extreme
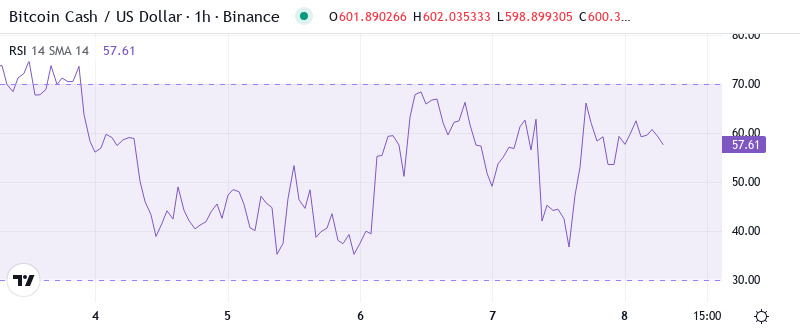
RSI sits at 57.3 on the daily timeframe, revealing a goldilocks zone for continuation – neither stretched to overbought extremes nor languishing in oversold territory. This balanced reading emerges after the oscillator bottomed near 35 in late December, matching levels last seen during August’s capitulation phase that preceded a 150% surge. What’s revealing is how RSI behaved during this week’s rally – climbing steadily without spiking above 70, suggesting genuine accumulation rather than speculative froth. So for swing traders, this measured momentum leaves room for another leg higher before exhaustion signals flash, particularly with BCH’s outperformance narrative gaining traction across crypto Twitter.
ADX at 25.1 Confirms Transition From Range to Trending Market
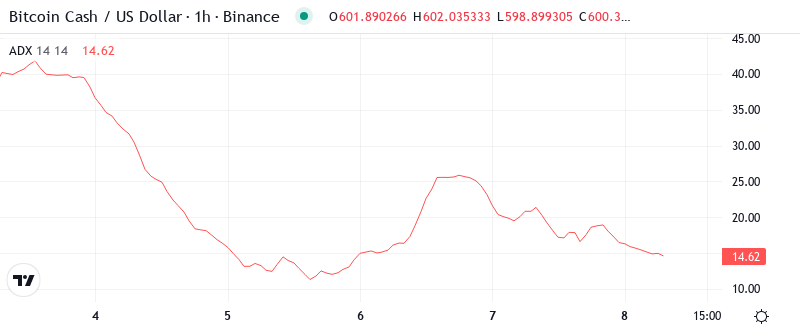
Looking at trend strength indicators, the ADX reading of 25.1 marks a crucial inflection point. After languishing below 20 for most of December – indicating choppy, directionless action – the indicator has now crossed the threshold that separates ranging from trending markets. Basically, this shift means range-trading strategies that worked during the $470-$540 ping-pong of late 2024 need adjustment. The climbing ADX suggests directional moves will extend further than traders expect, making breakout entries more attractive than mean-reversion plays. It is worth mentioning that similar ADX expansions in September and March both preceded multi-week trending phases that delivered 40%+ gains.
20-Day EMA Flips to Support After BCH Reclaims Entire Moving Average Stack
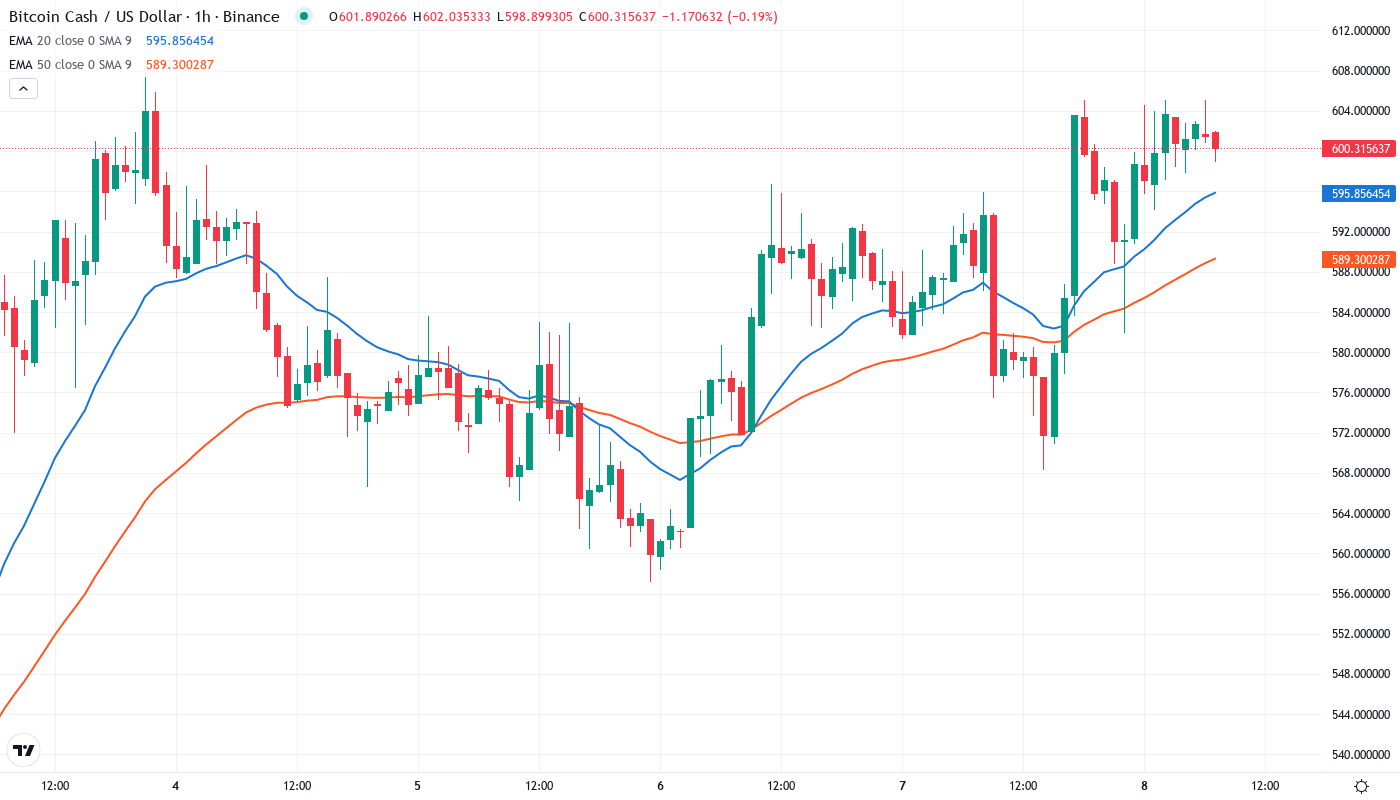
Price action tells a compelling story through the EMA ribbons. BCH trades decisively above the 10-day ($571), 20-day ($555), and crucially, the 50-day EMA at $545 – a clean sweep of all short-term moving averages that hadn’t occurred since early November’s rally phase. Most significant is the behavior at the 20-day EMA during yesterday’s intraday pullback. This level that rejected advances four times in December has now flipped to support, with buyers emerging aggressively at $555 to defend the breakout. The 100-day EMA lurking at $536 provides additional backing, creating a stacked support architecture that bulls can lean on during any profit-taking episodes.
Resistance Clusters Between $640 Monthly Pivot and $750 Psychological Target
Above current levels, sellers have fortified two distinct resistance zones that could slow the advance. The immediate hurdle sits at $640 where January’s R1 pivot converges with horizontal resistance from October’s local top – a confluence that typically attracts profit-taking from both algorithmic and discretionary traders.
Bulls now guard the $590 support level that aligns with this week’s breakout point and December’s resistance-turned-support flip. Any acceptance below this level would trap late buyers who chased the “BCH leads L1s” narrative, potentially triggering stops down to $540.
The market structure reveals buyers’ conviction as long as price holds above the critical $545 level on any retracement. This zone represents the confluence of the 50-day EMA, December’s resistance cluster, and the psychological half-thousand mark – making it the line in the sand for trend continuation.
Bulls Need Sustained Close Above $640 to Target $750 Extension
Should BCH secure a daily close above the $640 pivot resistance, the path clears toward $750 – a measured move target that aligns with the 161.8% Fibonacci extension of December’s range. The fundamental backdrop of BCH’s 2025 outperformance provides the narrative fuel for such an extension. Bears regain control if price gets rejected hard at $640 and breaks back below $590 with volume. This would signal a classic blow-off top pattern, trapping momentum chasers and likely cascading stops down to the $540-545 support cluster where the 50-day EMA waits. Given the technical setup and BCH’s newfound market leadership narrative, the most probable near-term scenario sees price consolidating between $590-640 as the market digests recent gains before attempting another thrust toward $750.