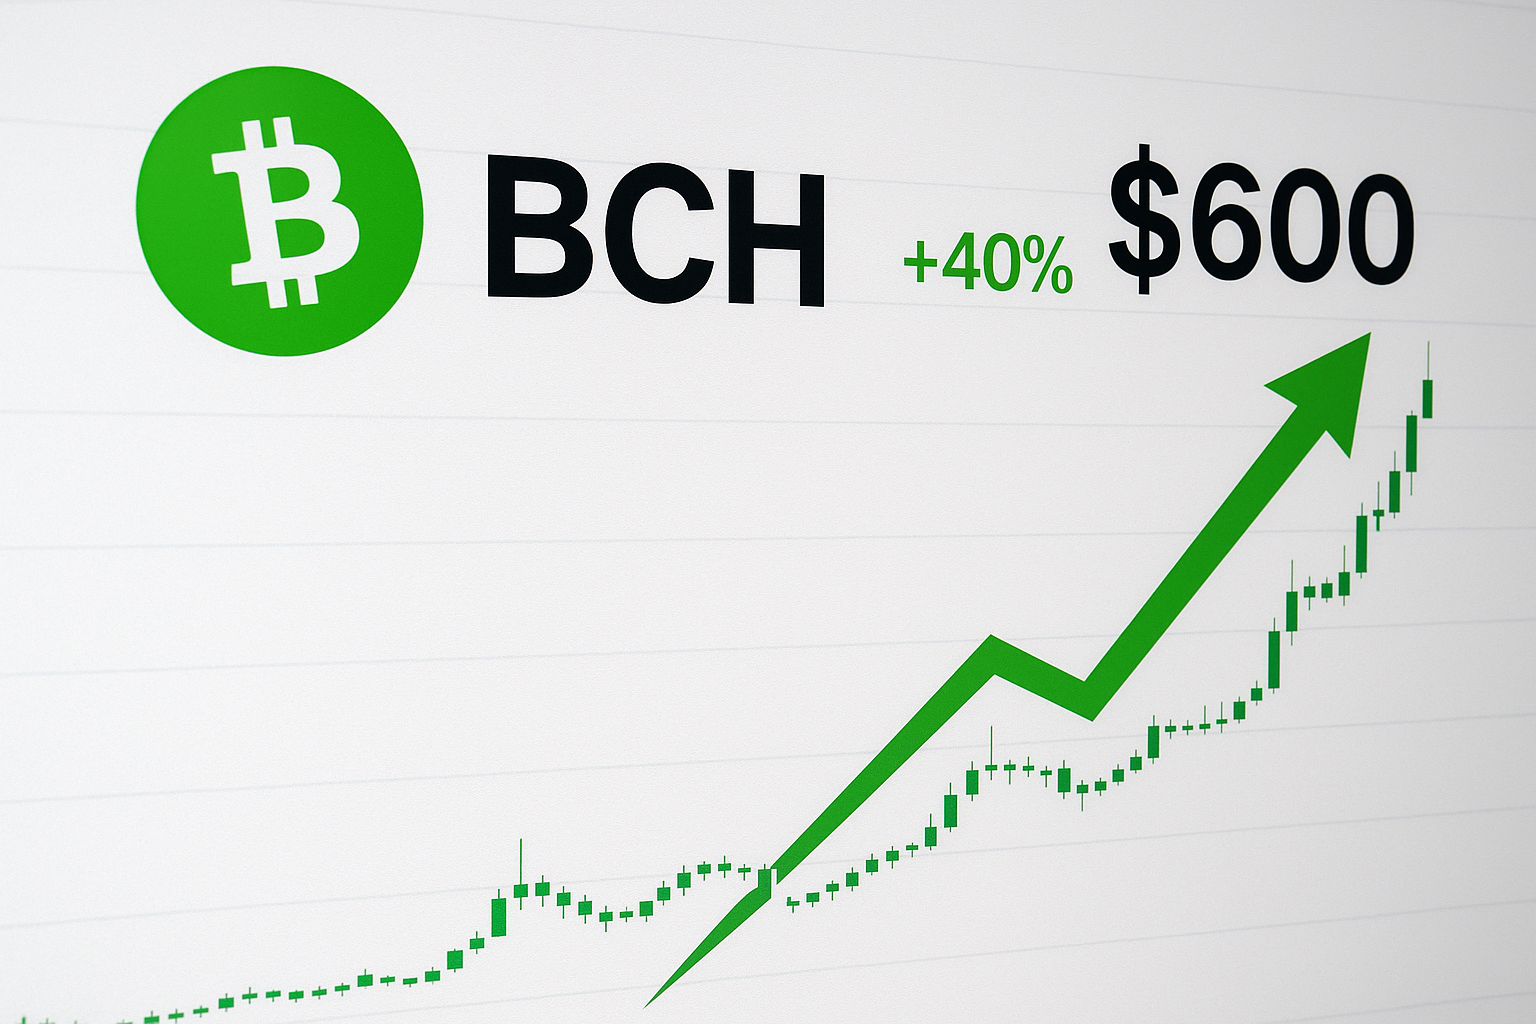
Bitcoin Cash Surges 40% to Lead All Major L1s, Tests Critical $600 Resistance
Market Structure Moves Higher
- 40% price increase since mid-December, outperforming major Layer-1 blockchains
- Six-figure whale accumulations reinforcing bullish sentiment
- Technical indicators align bullishly as BCH tests key $600 resistance
Bitcoin Cash (BCH) has seen a 40% price increase since mid-December. This means it has outperformed major Layer-1 blockchains in the same period. Another positive sign for BCH is the fact that whales with balances worth six figures have been accumulating across the Bitcoin ecosystem. This has helped to reinforce bullish sentiment for the digital asset. The latest signals show that technical indicators are aligning bullishly and BCH is testing make-or-break resistance at $600.
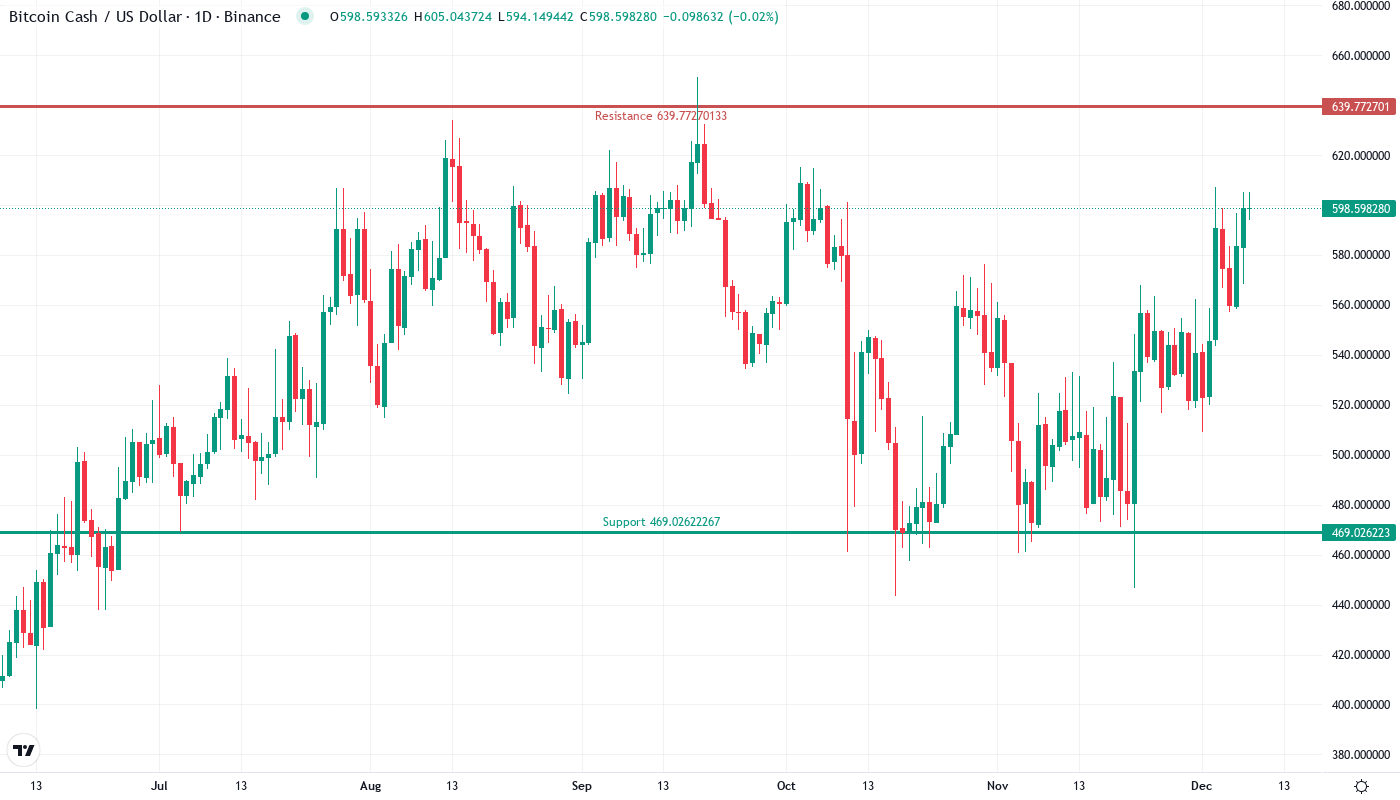
Bitcoin Cash started 2025 with a strong performance, increasing almost 37% over the previous month to reach over $598 – this makes BCH the best-performing major Layer-1 blockchain so far this year. This rally was further fueled by Bitcoin whales who bought 47,584 BTC in December which created a positive wealth effect throughout the entire crypto market. The question now for traders is: Will BCH be able to cross the $600 psychological level decisively, which has blocked advances three times since November?
| Metric | Value |
|---|---|
| Asset | BITCOIN CASH (BCH) |
| Current Price | $598.54 |
| Weekly Performance | 10.66% |
| Monthly Performance | 16.80% |
| RSI (Relative Strength Index) | 60.7 |
| ADX (Average Directional Index) | 25.1 |
| MACD (MACD Level) | 19.12 |
| CCI (Commodity Channel Index, 20-period) | 156.18 |
RSI at 61.76 Signals Room for Continuation After Reset
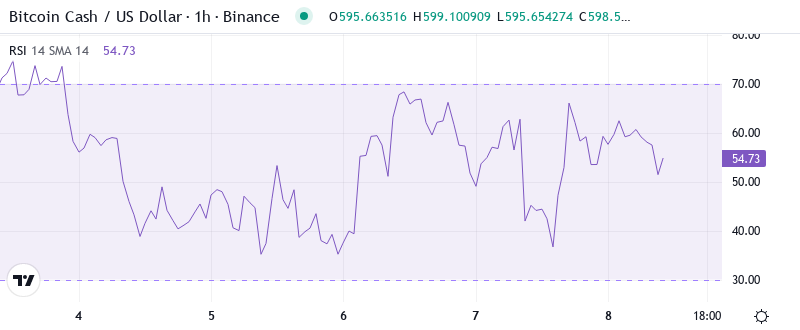
The oscillator is useful for identifying short-term overbought and oversold conditions, but readings above 70 or below 30 merely signal the potential for a temporary reversal within a dominant trend. Bitcoin Cash has been in a vigorous uptrend since testing the $370 level in late October, and its recent pullback appears to have run its course. The oscillator also gauges mass psychology, and the fact that traders remained stubbornly bullish during BCH’s latest dip indicates that enthusiasm is far from irrational exuberance.
Hence, the RSI remains the most attractive low-risk entry for would-be traders. As long as the daily close fits the conditions of the RSI and price within the next 3-6 days on the daily BCH/USD chart, traders can set their stop at around the 35-day moving average. My preference would be to see a daily close below the previous day’s low before getting stopped, as this offers a more conservative approach. A more aggressive stop can be placed directly below both the 9-day and 13-day moving averages. Alternatively, if the trade closes down with the swing low after reaching profit target, then traders stop can be moved to the 9-day moving average of the low.
ADX Climbs to 25.12 as BCH Shifts From Chop to Trending Mode
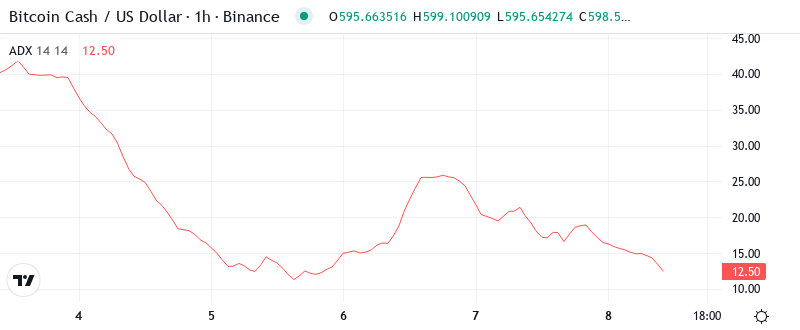
Indicators show that the smart money is betting that Bitcoin (BTC) will continue to lead the pack, and altcoins like Bitcoin Cash (BCH) will likely follow the powerhouse. It’s clear that trend strength is building for the BCH market, measured by the Average Directional Index (ADX), which most recently poked its head above water at 25.12. This important level measures the strength of the trend, and any reading above it shows strength in either direction.
To put it simply, when ADX rises above 25 following lengthy ranging, it often ushers in multi-week trends. Prior BCH occurrences similarly saw post-ADX breakouts of such moves of 50% or more especially amid bullish news. Ava Labs price momentum traders, are, therefore better off sticking with the trend given current outperformance against other primary L1s on all other metric fronts.
20-Day EMA at $554 Becomes Bulls’ First Line of Defense
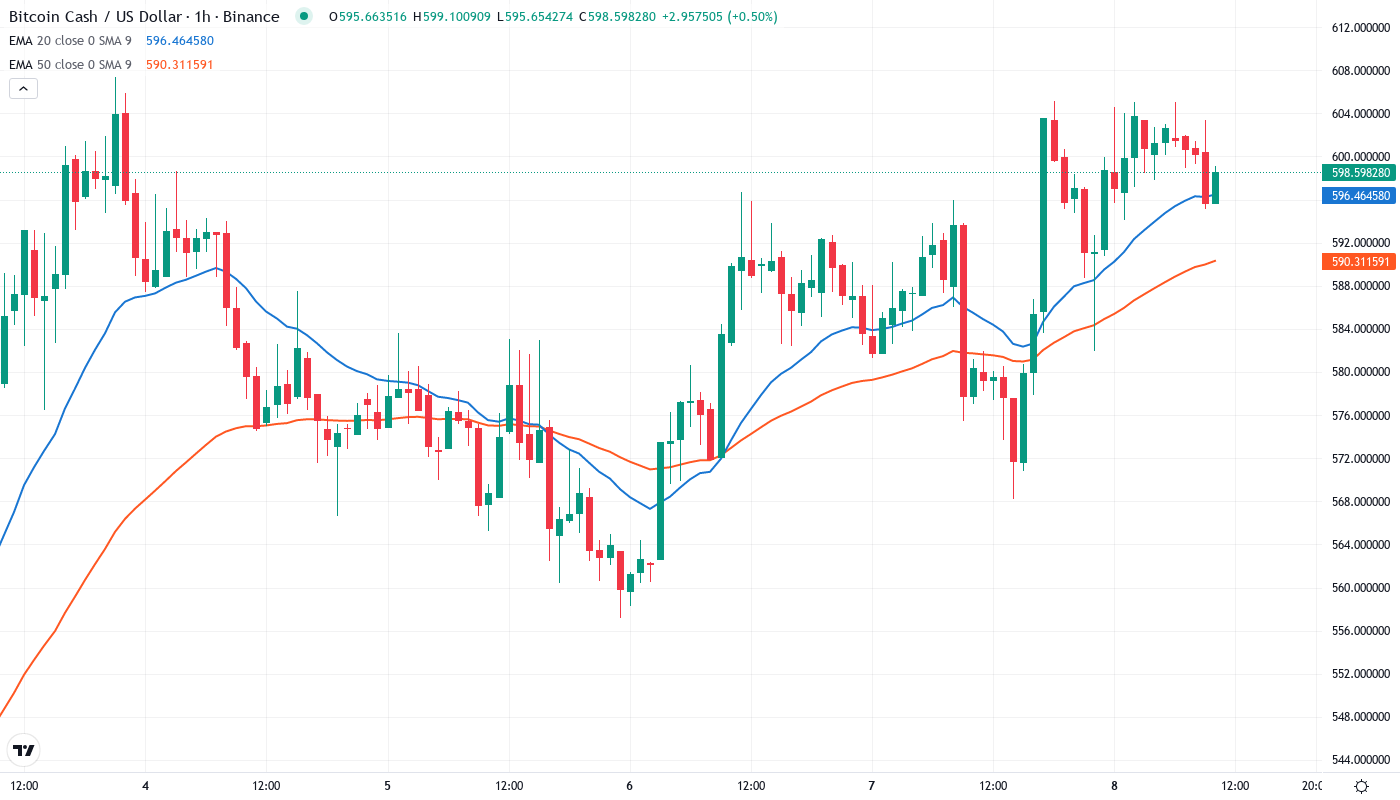
The moving average structure looks increasingly bullish, especially with BCH hovering above the entire EMA ribbon. The price is also above the 10-day EMA ($571), the 20-day EMA ($554), and the 50-day EMA ($538), all of which flipped to support from resistance during December’s rally. This solid move above the moving average cluster and the fact that BCH has rallied 40%, making it the top-performing L1, points to strong accumulation by institutions.
Especially telling would be a 50/100-day EMA bullish cross, the likes of which Bitcoin has recently achieved. The two-day RSI oscillator has given a 0 reading for 6 straight trading days. This indicates a relatively consolidated price that could soon gain momentum. A solid volume, technical, and on-chain exchange would all but guarantee that momentum. A two-week sprint towards $13k would be the tops for this move in my opinion.
Resistance Wall at $600-607 Meets Three Months of Failed Attempts
Sellers are currently in control with three consecutive weekly losses. The $450 level currently provides the most support, with a break exposing the $418 weekly higher low. A strong buying response on the initial test of this higher low in mid-December marked the significant pendulum shift in market sentiment and led to the current bull breakout. The weekly Ichimoku Cloud is now bullish as the Tenkan and Kijun have crossed up above the cloud.
Currently, bulls firmly defend several support levels below the current level. The first support is at the 10-day EMA, which is at $571. A strong support is at the 20-day EMA, which is at $554. The zone between the 50-day SMA and the 100-day SMA is the critical support. This support held during the last week of December, while Bitcoin was under pressure due to the movement of approximately 14,700 BTC from the now-defunct exchange Mt. Gox wallets.
Looking at the market structure, BCH is constructing a potential inverse head-and-shoulders formation on the daily chart, with the neckline sitting directly at the $600-607 resistance area. A sustained breach above that barrier would indicate a pattern-based target zone in the vicinity of $680, which would equal a 13% increase from current valuations. The formation is likely to gain additional reasonance due to BCH’s overperformance against other L1s as well as the general accumulation narrative seen in Bitcoin-related markets.
Bulls Need Daily Close Above $607 to Confirm Breakout Extension
If BCH manages to secure a daily close above $607 and does so with expanding volume, the path of least resistance is to the next major resistance at $680. The previous bearish rally swing high will then act as initial support, with the 60-day SMA following closely. Intermediate levels prior to the $680 area of interest, equidistant percentage resistance levels based on the current price, are $635 and $660.
If bulls seize control, they need to deliver a strong daily close above $600 to invalidate bearish theses and encourage sidelined investors to return. That would open the door for a potential renewal of the rally, with the next area of interest likely near the $635-640 resistance confluence.
Considering BCH hashrate growth has outstripped major L1s since late October (15d MA basis), there is an adequate fundamental rationale for price/beta catching up, especially since BCH still offers the least resistance on this basis. Consequently, we have revised up our December forecast to $650-$700.