Bitcoin Cash Surges 32% Monthly as Bulls Reclaim Critical Support Zones

Market Structure Shifts Higher
- Bitcoin Cash (BCH) had its best month on record since strong gains back in spring.
- Closing April up almost 32%.
- A historic breakout saw volume return in force, with further upside now likely.
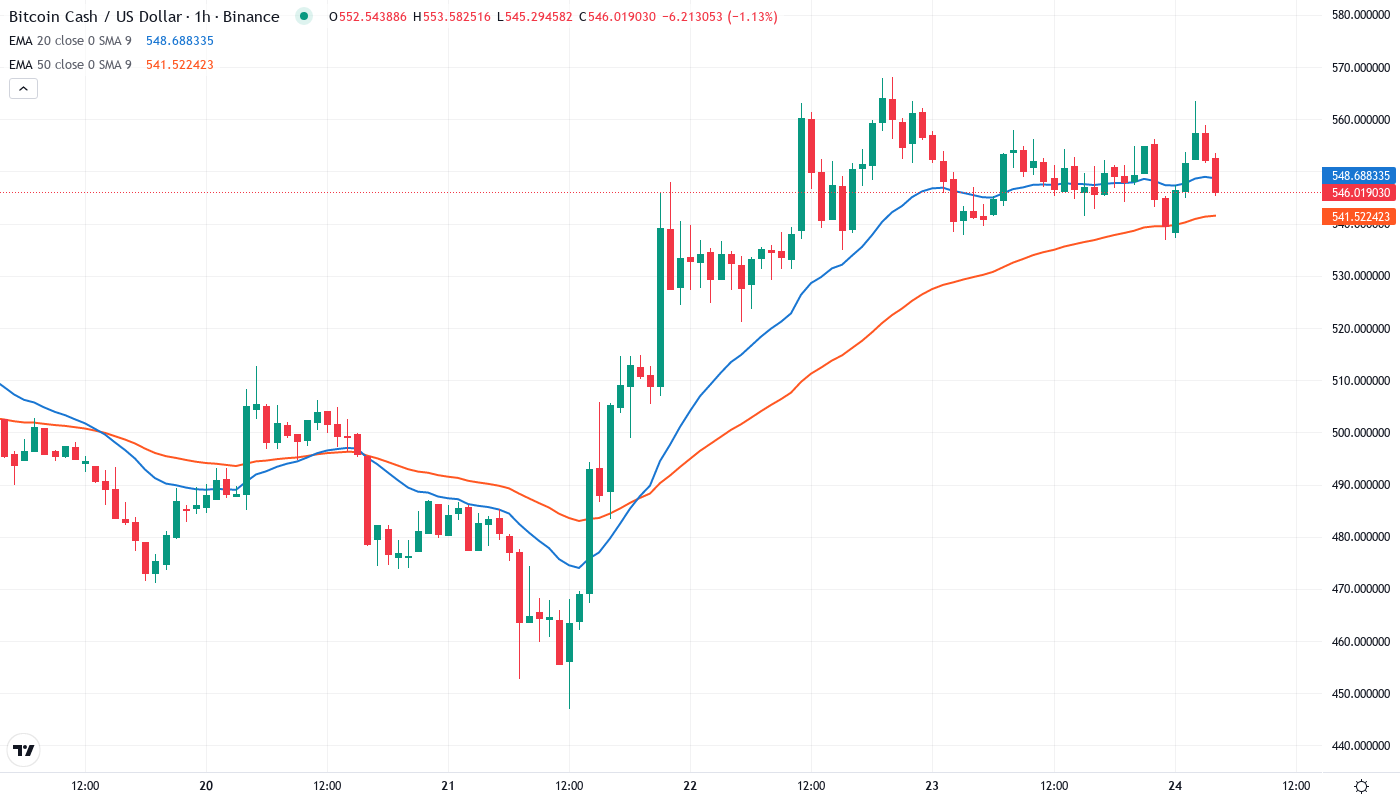
Bitcoin Cash crossed its 200-day moving average (DMA) this week to “green”, meaning the price is healthier than several months prior. This milestone for BCH indicates a month-to-date performance of 31.78%, the largest monthly gain since the May rally over 100.00%. The news comes as the overall cryptocurrency environment bounces from a crazy October that scared many potential buyers away. BCH, in particular, has benefited from an increased overall momentum trader interest after seeing its break-out pattern was confirmed with aggressive volume. The main question that comes to mind is: Can the price hold above the $515-520 newfound zone of support, or will bulls take profit at the $600 psychological level?
| Metric | Value |
|---|---|
| Asset | BITCOIN CASH (BCH) |
| Current Price | $546.28 |
| Weekly Performance | 12.97% |
| Monthly Performance | 8.51% |
| RSI (Relative Strength Index) | 56.2 |
| ADX (Average Directional Index) | 18.0 |
| MACD (MACD Level) | 4.23 |
| CCI (Commodity Channel Index, 20-period) | 179.77 |
RSI Climbs to 54.12 – Room Remains for Continuation
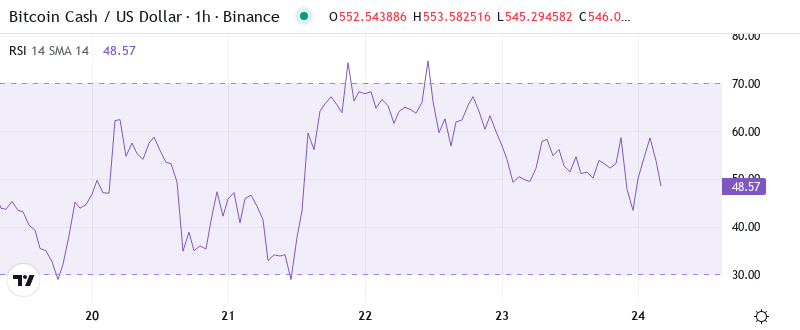
The Relative Strength Index or RSI on the daily timeframe is currently perched at 54.12, considered neutral and indicative of no warning signs of exhaustion to the highs, or panic during the recent dip to the lows. RSI has been steadily on the rise after hitting below 30 to levels now above 50. The weekly RSI is at 56.21 which, like the daily, shows that the level overbought conditions that the price of Bitcoin Cash reached during the summer and subsequent drop has been adequately reset.
What is interesting to note is the way RSI has acted throughout this recent push up: it has risen steadily rather than a vertical spike which is what you see with FOMO induced pumps. March saw a similar RSI setup before its push to $700+, but that started from much deeper oversold levels. So with the swing traders a nice balanced RSI like this, there is certainly juice left in the tank to try and print another high, especially if the volume keeps turning up to push the news of the breakout confirmation.
ADX at 17.99 Keeps Choppy Conditions in Play Despite Breakout
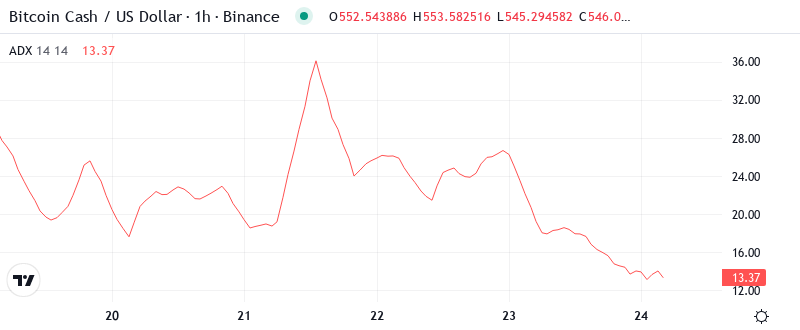
When we look at trend strength the ADX is reading just 17.99 which is well below the 25 levels which indicate trending conditions. This likely seems positive given BCH’s performance over the month but it actually highlights something crucial about the market structure: the move higher has been more of a violent reversion than a steady trend and BCH basically ripped through multiple resistance levels in sharp bursts over the month, rather than grinding steadily higher.
To put it simply, the low ADX indicates that we are shifting from conditions with little direction to conditions with a clearer trend, but we are not yet in a well-established uptrend. The +DI of 19.45 is slightly greater than the -DI of 9.19, indicating bullish control, but it’s a weak signal for the bulls. Therefore, day trading is likely to produce further wobbles rather than some great carrying breakout—get ready for pretty violent swings as the market adjusts to this breakout. The ADX setup is identical to what we saw in September before that 40% explosion.
50-Day EMA at $516 Becomes Critical Support After Resistance Flip
The 10-day is also about to bullishly cross the 50-day, which would complete the Holy Trinity for the uptrend merchant. For BCH to jump on the next rung that will lead to $750, it simply has to consolidate and continue doing what it has been doing for the last three weeks.
A more powerful signal is the golden cross, which occurred shortly after the April high due to the bullish alignment between the 100- and 200-day EMAs. The timing couldn’t have been better as it hit just in time to last the three-month rally to the Q2 high. Better still was how the pullback from that top managed to perfectly retest the 200-day as support (green) before the breakout last week.
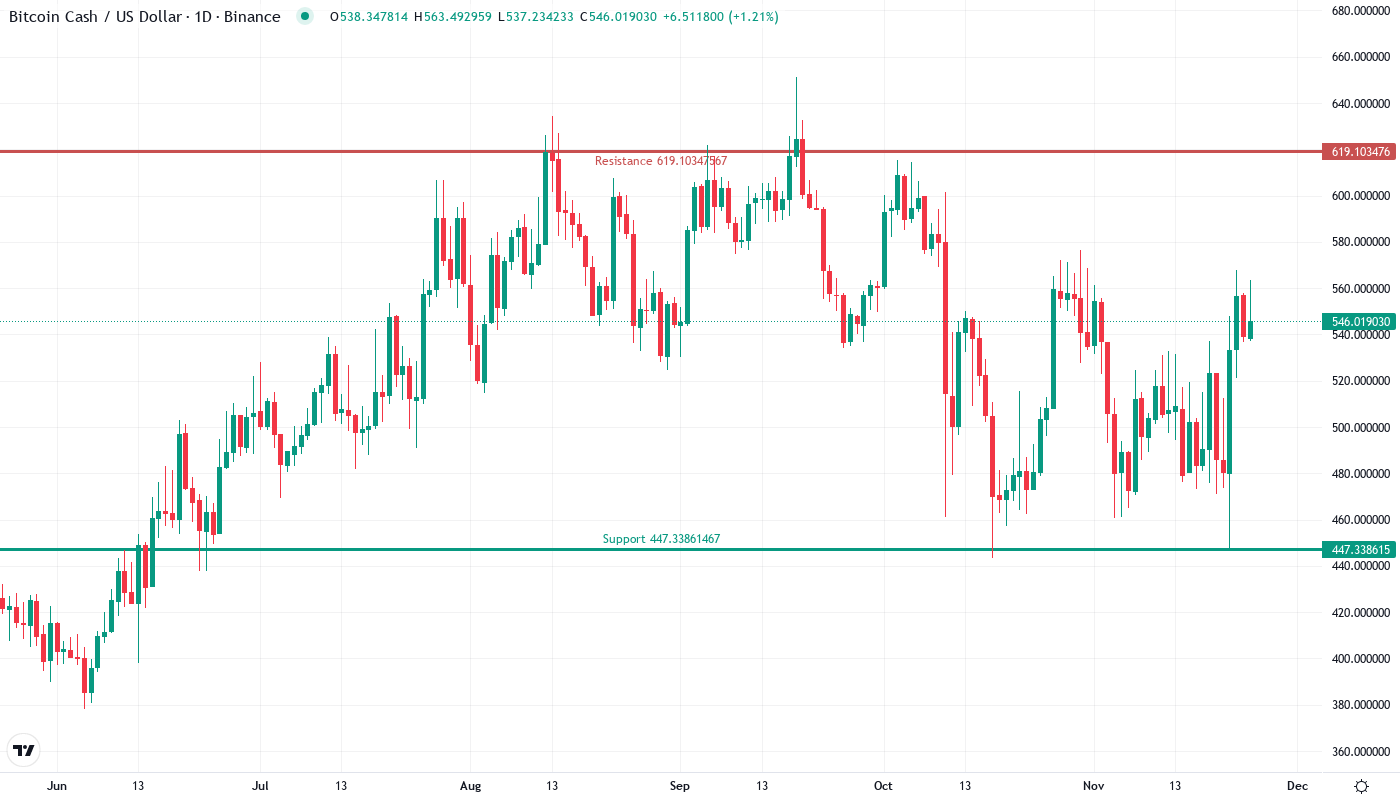
Resistance Stacks Between $576 Monthly High and Psychological $600
Sellers have been able to defend the $576 level, which is slightly above the current price. This level represents December’s monthly high and is also the upper boundary of the current breakout range. The weekly high at $583 further solidifies this resistance zone as a double top formation that must be broken through to continue. By analyzing the volume, we can see that substantial profit-taking has occurred each time the price approached this zone.
The $515-520 support would have to hold during the current test for reattempting some upside. If bulls can sustain a breakout, the first resistance test lies at $570. If buyers can clear that on volume, then $600 becomes the main resistance to target.
The market continues to exhibit accumulation that is congruent with the breakout confirmation news with HL’s established at $447, $494, and $511 during the last month. Meanwhile, the resistance levels continue to be tested following the previous week’s breakout. This is an ascending triangle and those have a disposition to break upwards, especially with an increase in volume which we have seen. The monthly pivot at $619 is the next major resistance that the bulls will need to overcome the $576-583 level.
Bulls Must Clear $583 to Unlock $650 Measured Move Target
If BCH can maintain a daily close above $583 and do so with increased volume, then the measured move from the current accumulation zone is $650-675. The confirmation of the breakout and subsequent increase in volume serve as sufficient evidence to support such a move, with the asset’s momentum traders likely returning after a shutdown of multiple months. Bulls need to take significant action over the weekly high if they wish to launch another buying phase.
On the contrary, the position turns invalid if price is strongly repulsed from $576 and falls back under $515. In this case, breakout traders lured in by the recent announcement are caught on the wrong side of the market, their positions are probably liquidated as the price sinks down to the 200-day EMA at $507. A drop beneath this level would invalidate the entire positive setup and put $480 back in sight, the location of the 100-week moving average.
Based on all that technical setup and the fact that sentiment has begun to turn for the better following the security scare in October, the most likely immediate-term trajectory is that BCH will consolidate somewhere between $520 and $576 before making another assault on $600. Dips towards areas of support are likely to be bought rather than spark a stampede for the exit.