Bitcoin Cash Surges 17% Weekly as Volume Explodes Above Critical Resistance
Market Structure Shifts Higher
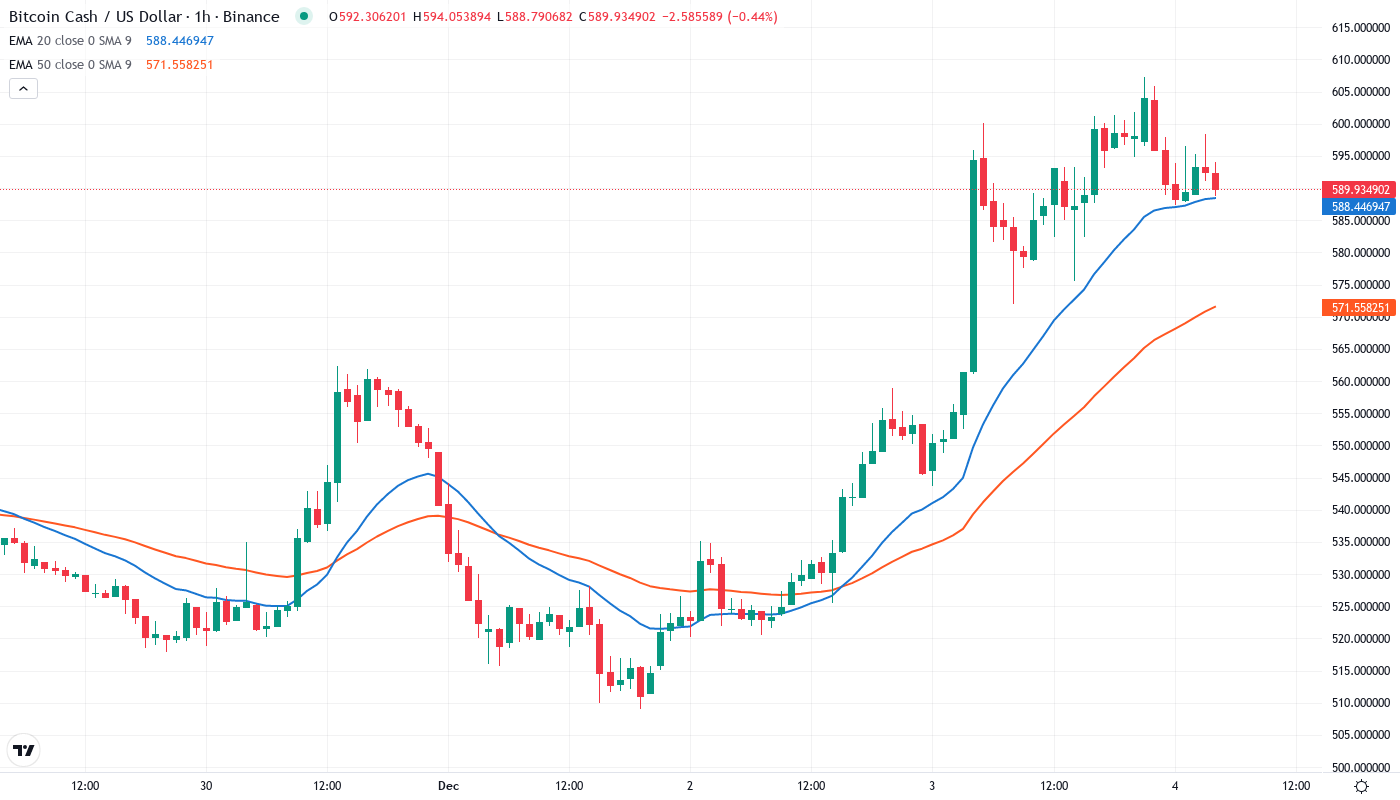
- BCH цена пробила уровень сопротивления $590 с объёмом на 18% выше среднего за 10 дней
- Индикатор RSI восстановился из перепроданности, повторяя конфигурацию перед ралли в августе
- Объём и динамика указывают на потенциал продолжения роста, быки должны удержать 50-дневную EMA на $531
Bitcoin Cash (BCH) has seen a tremendous uptrend in trading price after breaking the $590 key resistance level with a significant increase in volume, which was 18% above the coin’s 10-day average. The relative strength index (RSI) has reset from oversold conditions, setting up a similar momentum picture to that which occurred before the last rally in August.
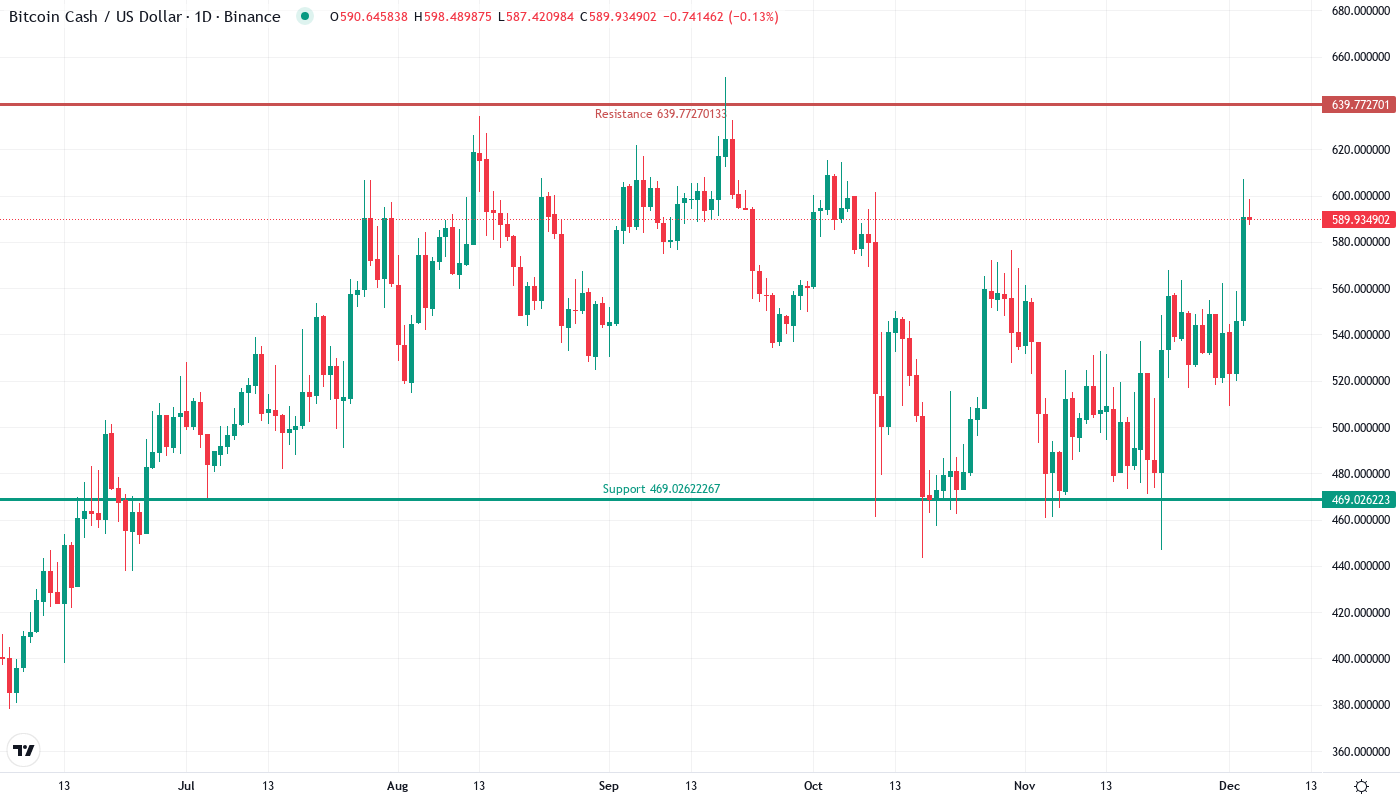
Bitcoin Cash made its move to the upside this week, gaining 17.09% on the week to come to rest at $591.91 as the real trend momentum left last month’s compression zone. Part of that surge came when trading volume nearly doubled on the move above $590, adding confirmation to the suspicion of many technical traders that BCH was simply winding up for some sort of wide-range thrust. The big question for traders is whether or not bulls can protect the newly regained 50-day EMA at $531.
| Metric | Value |
|---|---|
| Asset | BITCOIN CASH (BCH) |
| Current Price | $591.91 |
| Weekly Performance | 8.83% |
| Monthly Performance | 17.09% |
| RSI (Relative Strength Index) | 61.4 |
| ADX (Average Directional Index) | 20.6 |
| MACD (MACD Level) | 14.18 |
| CCI (Commodity Channel Index, 20-period) | 185.77 |
Momentum Reset From Oversold Territory Matches August’s Pre-Rally Configuration
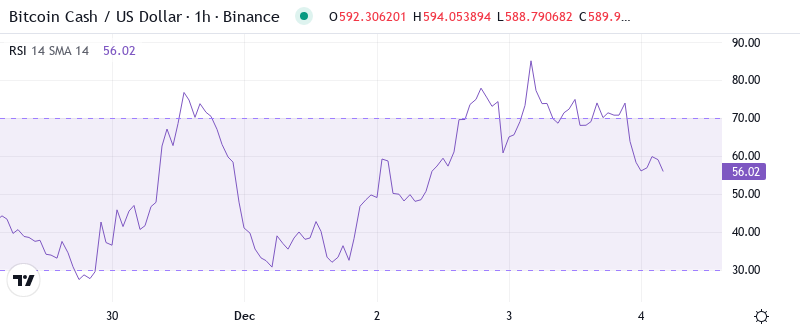
The Relative Strength Index is at 61.95 on the daily chart and has increased after rising from deeply oversold levels of around 30 only two weeks ago. This kind of rapid change in momentum is the same one we saw in August wash out before BCH doubled in price to $607. Extreme negativity turned into extreme positive as soon as the right levels were taken back.
What is interesting is the way RSI acted during the breakout. Instead of shooting up to overbought levels above 70, the oscillator consolidated between 55 and 65 as the price was going up. This means that for swing traders, the momentum increased in a more healthy way, showing that there is still room for the price to go higher and this level is not a maximum exhausting level. Also, the past Web3 security events from October are starting to be forgotten.
ADX at 20.58 Signals Early Trend Emergence After Two-Month Consolidation
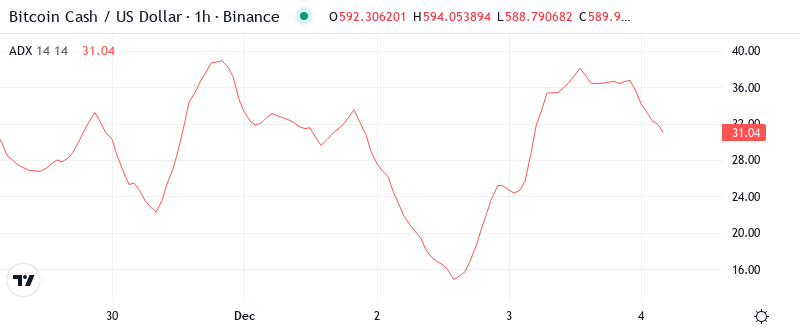
When looking at trend strength indicators, the ADX reading of 20.58 shows an important turning point. Having been below 20 for the majority of October and November – which are classic bound conditions- the indicator has been pushing into the type of bound where statistically you are more likely to see some trending moves. BCH basically spent 2 months building energy in a compressed state between $450-$550, and that stored potential has just started to release.
In other words, when the ADX moves higher from a low level, it signals that a potential new trend could be developing. However, it doesn’t indicate the direction of the trend. Therefore, this week we’re seeing the uptrend gaining strength. The higher the ADX reading is, the stronger the uptrend is, and vice versa.
50-Day EMA Flips From Resistance to Support After Three Failed Attempts
Price action through the EMA ribbons provides an interesting reversal narrative. BCH is now trading above the 10-day ($552.57), 20-day ($538.70), and most importantly, the 50-day EMA ($531.16), which blocked advances on three occasions since September before giving in this week. The 100-day EMA is at $531.14, making it essentially a double support zone needed to be protected by the bulls.
Even more telling is the squeeze between these averages – they’ve crushed themselves into a tight $20 range after being spread over $100+ during the summer trends. This MA squeeze typically precedes larger explosive moves, and with price breaking above the entire cluster on volume, likely to the upside. The current resistance area at $531 would be the first green line the bulls want to see taken out and then defended during any retracement.
Resistance Stacks Between $639 Monthly R1 and $697 Psychological Level
There are several resistance levels above the current price, which are important from both technical and psychological points of view. First, the price of $639.77, which is the monthly R1 pivot, combined with a 38.2% Fibonacci retracement of the 2024 downtrend. The next one is even higher: the weekly R2 at $697.48. This level stopped the price rally twice this year and also stands at the psychologically important level of $700.
Bulls have a stronger support system to defend after this week’s rally turned several resistance levels into support. The $590 breakout point offers initial support, backed up by the 50-day and 100-day EMAs conjoining at $531. Next, the monthly pivot at $518.52 provides even firmer support, with the October low at $446.77 acting as the critical level that would break the entire bullish argument.
The current setup mirrors a traditional accumulation breakout in which smart money accummulated positions during the October security breach hysteria, then breached resistance after the final weak hands capitulated. The pattern confirms buyer control provided that BCH remains above $531 on a retracement, with each successive higher low solidifying support for potential advances into $697.
Bulls Need Weekly Close Above $590 to Confirm Sustainable Recovery
If the price is able to stay above $590 by the end of trading on Friday, bulls will have received confirmation of a real trend change rather than getting faked out again. The next target would be $639.77, where monthly R1 and Fib resistance converge – above the level, $697 is next in the crosshairs, with the strengthening Web3 security story underpinning the gains.
If the bearish scenario plays out, I believe that the NFT sell-off could influence the correction zone as new buyers absorb selling pressure. This would rebuild long liquidity to fuel a rebound over time.
Based on the technical perspective that combines momentum reset, trend resumption, and MA support cluster, the most likely short-term route would be for BCH to re-consolidate between $570-$610 to process the 17% upswing and then have another shot at the $639 cap. The definitive indicator will be whether or not any retreat is contained above the critical $531 support cluster.