Bitcoin Cash Surges 14% Weekly as Bulls Guard $584 Support

Market Structure Shifts Higher
- BCH outperforms major L1s with 14% weekly gain, leading cryptocurrency markets into 2025
- Bulls defend crucial $584 support level after testing it multiple times this week
- Technical indicators suggest momentum building from oversold conditions
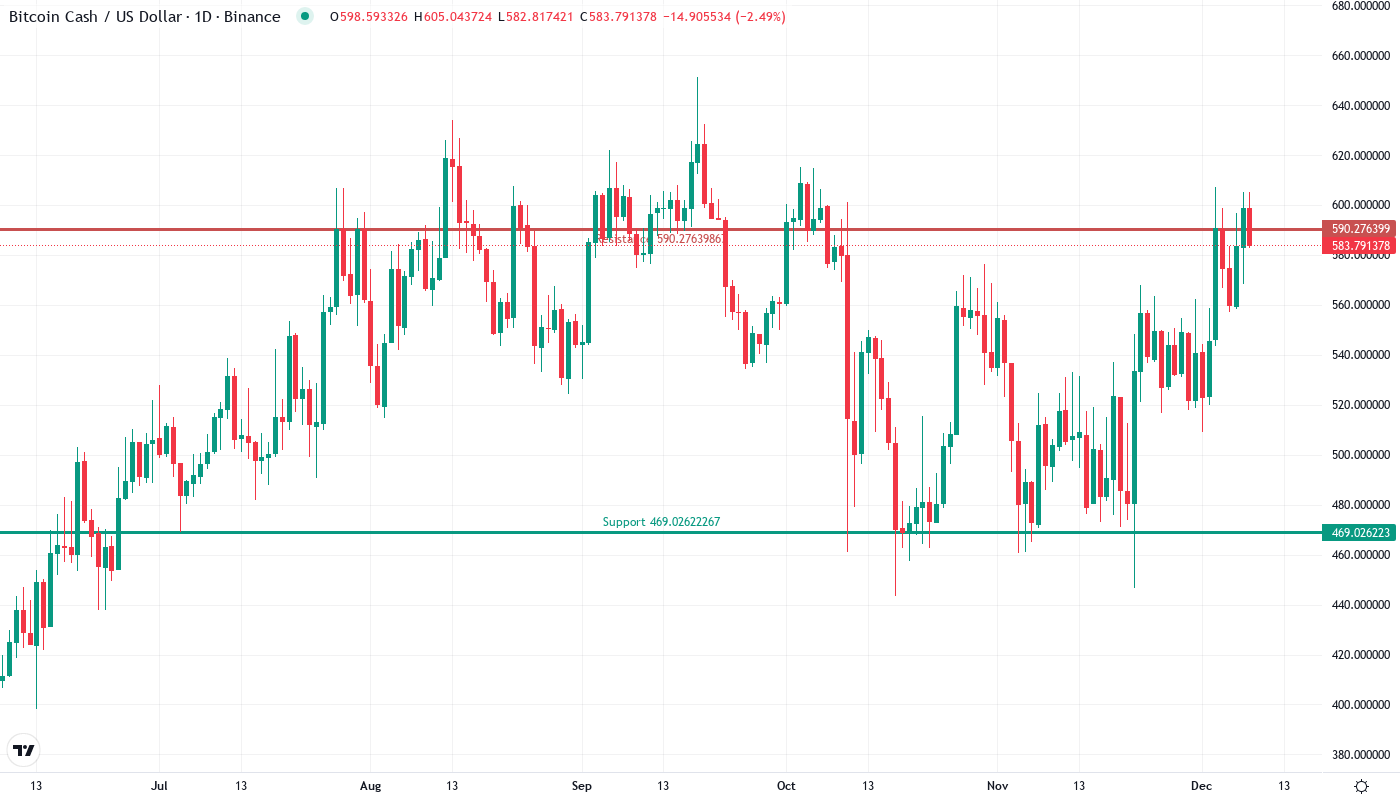
Bitcoin Cash has kick-started 2025 with a convincing 14% weekly surge to $584, outpacing all major Layer-1 cryptocurrencies and drawing attention from traders who’ve been waiting for altcoin leadership to emerge. The move comes as BCH recovered from December’s correction that saw prices tumble from the $607 monthly high, with bulls now guarding the higher lows they’ve set by taking back critical psychological price levels. The main question for traders is: can this momentum sustain above $584 support, or will sellers defend the overhead resistance stacking between $590-607?
| Metric | Value |
|---|---|
| Asset | BITCOIN CASH (BCH) |
| Current Price | $584.47 |
| Weekly Performance | 8.06% |
| Monthly Performance | 14.06% |
| RSI (Relative Strength Index) | 57.6 |
| ADX (Average Directional Index) | 25.1 |
| MACD (MACD Level) | 18.00 |
| CCI (Commodity Channel Index, 20-period) | 136.80 |
RSI Climbs From Oversold Territory – Room for Further Gains
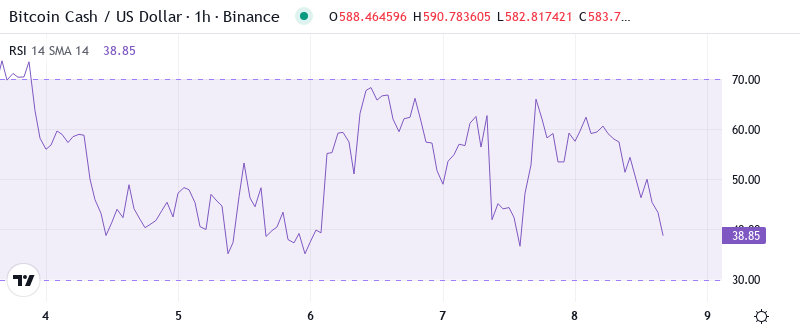
Momentum indicators paint an encouraging picture for bulls as RSI sits at 52.2 on the daily timeframe, having climbed from oversold readings near 35 just days ago. This reset from extreme selling pressure mirrors the setup we witnessed in early November, when similar RSI recovery from oversold conditions preceded BCH’s run toward $600. The oscillator’s current neutral positioning suggests neither bulls nor bears hold extreme control, leaving plenty of room for price expansion in either direction.
What’s revealing is how RSI behaved during this week’s 14% surge – the indicator advanced steadily without spiking into overbought territory above 70, currently reading 57 on shorter timeframes. This measured momentum gain, rather than a parabolic spike, historically correlates with more sustainable rallies in BCH. So for swing traders, this balanced RSI configuration means the current rally has legs to run before exhaustion signals appear, particularly if volume continues supporting the advance.
ADX at 25.1 Signals Trend Emergence From Consolidation
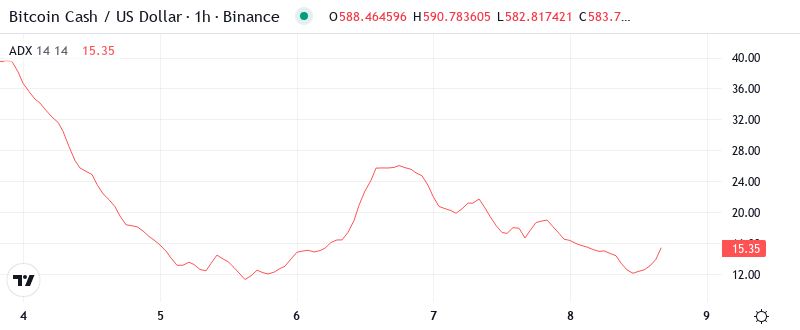
Trend strength metrics confirm we’re transitioning from choppy consolidation into directional movement, with ADX climbing past the crucial 25 threshold to reach 25.1. Basically, this reading indicates the market is shifting gears from the range-bound conditions that dominated late December into a trending environment where momentum strategies gain edge. The crossover above 25 marks the first time since early December that trend-following setups offer statistical advantage over mean-reversion plays.
Looking at the ADX trajectory, the indicator accelerated from readings below 20 just a week ago, matching the pattern observed before November’s trending move higher. This rapid ADX expansion from compressed levels often precedes BCH’s most explosive moves, as it signals fresh capital entering after extended consolidation. Therefore, day traders should adjust their strategies toward breakout and momentum plays rather than fading moves at range boundaries, particularly with BCH’s 2025 outperformance drawing increased attention from traders rotating out of underperforming L1s.
20-Day EMA at $552 Flips From Resistance to Key Support
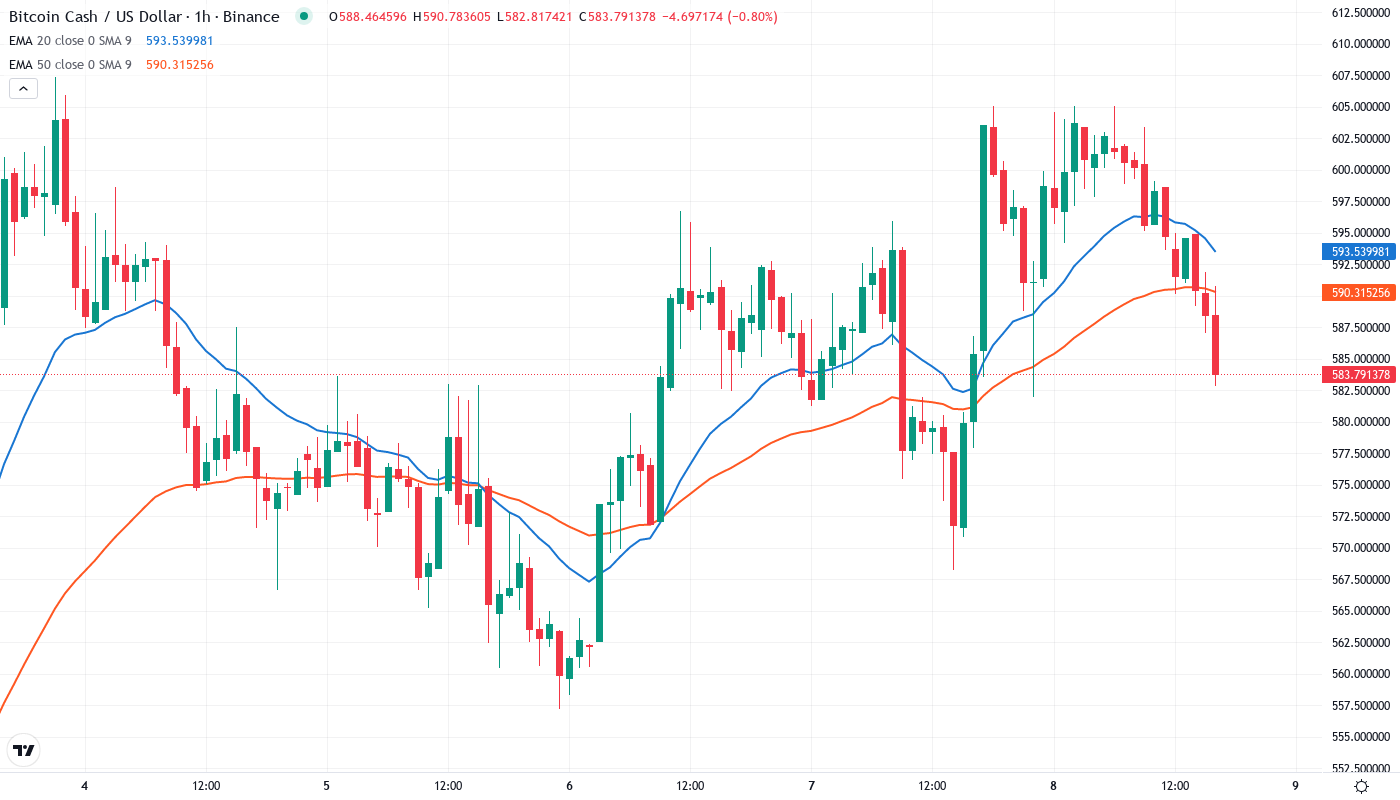
Price action through the moving average structure tells a bullish story, with BCH trading above both the 10-day ($568) and 20-day ($552) EMAs after reclaiming these levels during this week’s surge. The 20-day EMA deserves particular attention here – this level capped rallies three times in late December before finally breaking this week on strong volume. That former resistance at $552 now transforms into immediate support that bulls must defend on any pullback.
More significant is the relationship between current price and the longer-term averages, with the 50-day EMA sitting at $538 providing a deeper support backstop. BCH hasn’t traded below this critical average since the December correction began, and the successful defense of this level during last week’s test built the foundation for the current rally. The 100-day EMA lurks lower at $534, creating a support cluster between $534-538 that would need to break for any bearish scenario to develop.
Resistance Stacks Between $590-607 as Bulls Eye Monthly Highs
Above current levels, sellers have fortified resistance in the $590-607 zone where December’s monthly high coincides with psychological round numbers. The immediate resistance sits at $590, roughly $6 above current price, where profit-taking emerged during yesterday’s probe higher. This level rejected advances twice this week despite the bullish momentum, suggesting sellers defend it actively.
Support architecture looks more robust after this week’s price action, with the immediate floor at $584 (current price level) backed by deeper support at $552 (20-day EMA) and the critical $534-538 zone housing both 50 and 100-day EMAs. The fact that BCH bounced precisely from the $538 area last week before launching this 14% surge validates this zone as a technical floor bulls will likely defend aggressively.
Between these boundaries, the market structure reveals accumulation patterns typical of pre-breakout consolidation. The successful reclaim of all short-term moving averages while holding above longer-term support creates the technical foundation for an assault on December highs, particularly with BCH leading L1 performance metrics attracting fresh capital to the setup.
Bulls Target $607 Breakout While $538 Stands as Line in Sand
Bulls need a daily close above $590 resistance to confirm continuation toward December’s $607 high, with BCH’s market-leading performance providing fundamental tailwind for the technical breakout attempt. Should buyers push through $590 on expanding volume, the measured move targets $625, representing the next major resistance from historical price action. The convergence of strong technicals with BCH’s 2025 outperformance narrative creates conditions for sustained upside momentum.
The bearish scenario triggers if price fails at $590 resistance and breaks below $552 support on heavy volume – this would trap recent buyers who chased the 14% rally and likely cascade stops toward the $538 defense line. A breakdown below $538 would shift market structure bearish, opening downside toward $500 psychological support where buyers historically emerge.
Given BCH’s relative strength leading all major L1s, combined with RSI room to run and ADX confirming trend emergence, the highest probability path points toward continued consolidation between $584-590 before another leg higher attempts the monthly high at $607. The technical setup favors bulls maintaining control above $552 support while building energy for the next directional move.