Avalanche Tests Critical Support as SIERRA Launch Sparks Ecosystem Interest
Market Structure Shifts Higher
- Price rebounded above $15.66 support, avoiding a drop to $14.64 and crossing the 100 SMA.
- RSI and ADX readings signal oversold conditions and weak trend, favoring mean reversion and range trading.
- Critical resistance at $17.24 (20-day EMA) must be cleared for a bullish reversal, with strong support between $14.64 and $13.61.
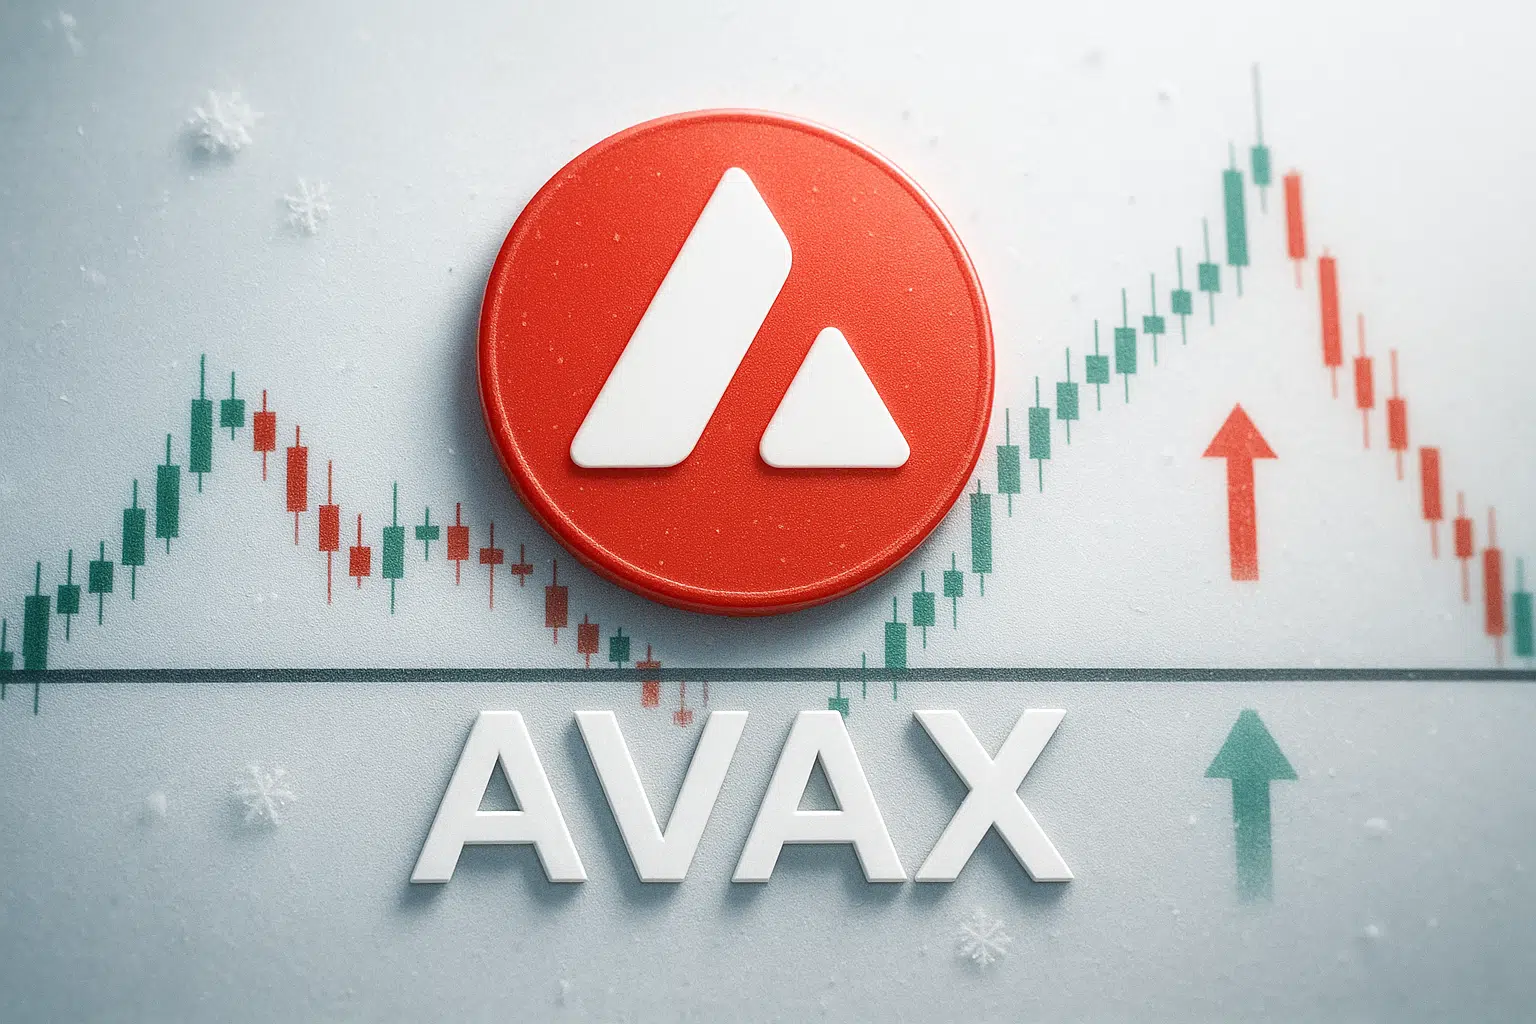
Avalanche recovers from the support embraced at $15.66. Initially helping to avert declines from extending to the primary support at $14.64. Losses’ PET to $15.66 did not stay for long. The recovery has been gradual, allowing AVAX to step past the 100 Simple Moving Average (SMA) on the 4-hour chart.
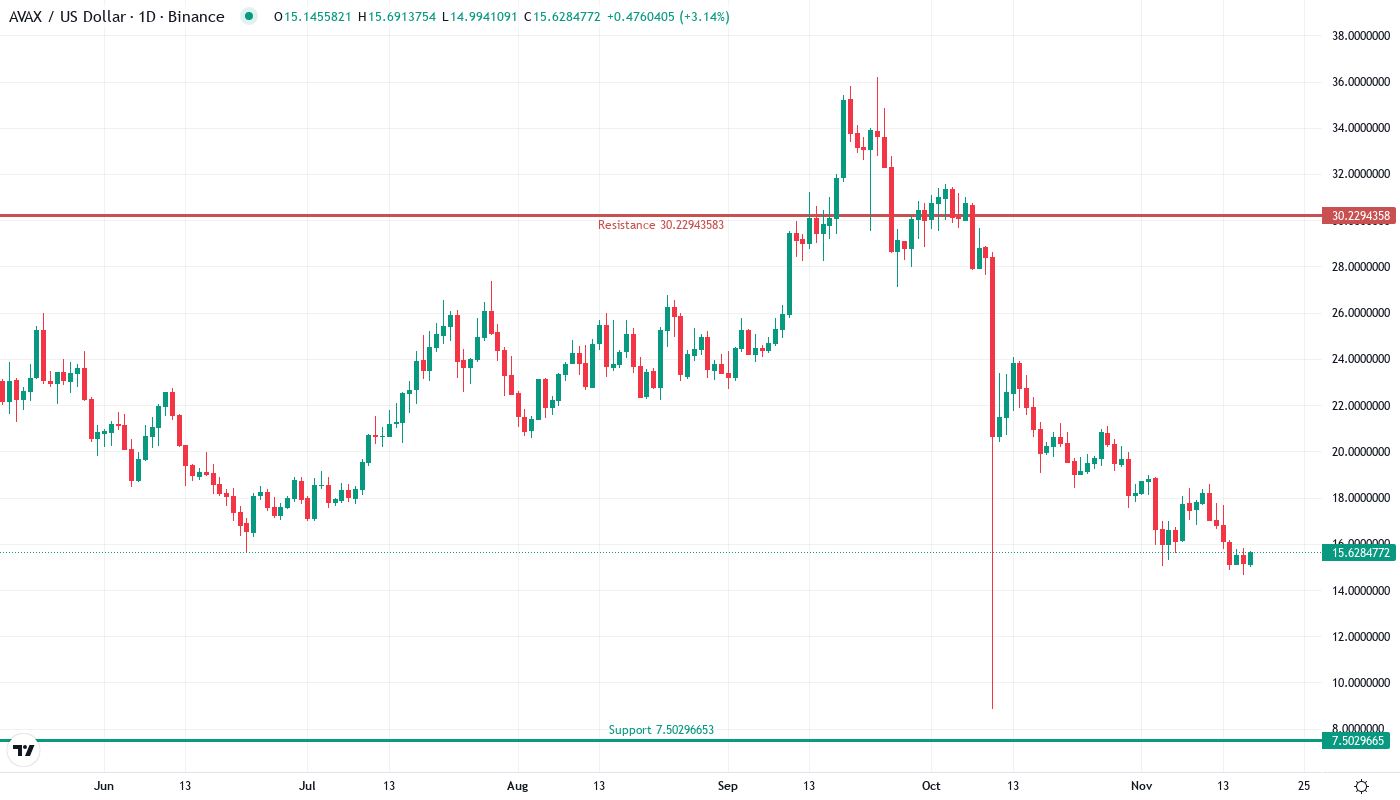
Avalanche bounced from its weekly low of $14.64, and is now at $15.66 as ecosystem news provides new energy to a relentless downhill movement over the last three months. The token lost 33.88% this quarter, but the 11.79% loss this week indicates a slowdown as buyers appear at multi-monthly levels of support. The most important thing for traders is whether an intersection of institutional adoption headlines and technical support could bring an end to the losses that have wiped out more than 50% of AVAX’s value from the highs of the year.
| Metric | Value |
|---|---|
| Asset | AVALANCHE (AVAX) |
| Current Price | $15.66 |
| Weekly Performance | -11.79% |
| Monthly Performance | -21.62% |
| RSI (Relative Strength Index) | 36.7 |
| ADX (Average Directional Index) | 51.1 |
| MACD (MACD Level) | -1.51 |
| CCI (Commodity Channel Index, 20-period) | -105.89 |
RSI at 36.70 Signals First Oversold Territory Since Summer Washout
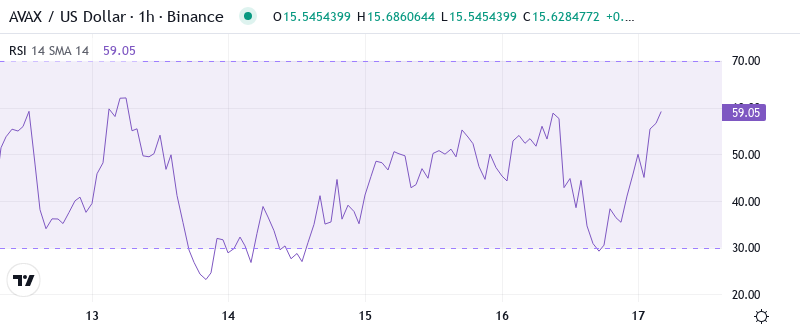
With the RSI again in that neighborhood, a similar reflexive rally could be in the cards. The pending cross-currents of the sixth-month extension and potential tariff setbacks could be the catalyst. The relative strength index is also testing a level that marked significant bottoms during previous bear markets. Buyers should be patient as no rush is warranted when the real panic has not yet erupted. It remains a volume game.
Therefore, for swing traders, this oversold bounce is the cleanest mean reversion setup in months, especially given the extent of LINK’s collapse after hitting all-time highs at the beginning of March. The daily RSI is currently at an inflection point of 40 and bestows higher risk players the first rung of potential support (waiting for confirmation). The weekly RSI is also rapidly approaching oversold at 38.18 (again showing the demands for such a buy the blood opportunity).
Trend Strength Fades Below 18 – Range Traders Take Control
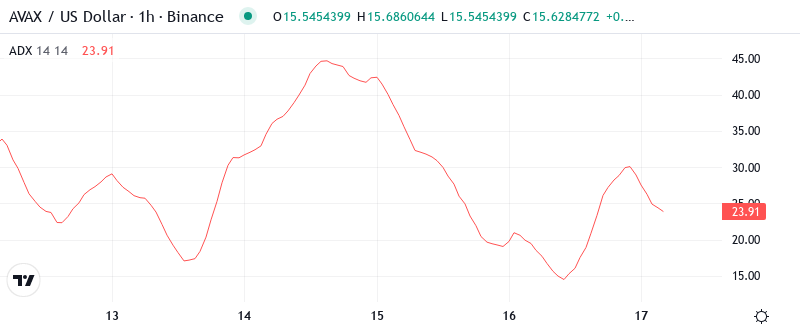
The Average Directional Index (ADX) shows a reading of 17.92 on the daily chart, which is the weakest directional movement seen since the summer consolidation. As its name implies, this index measures the strength of a trend; it’s been in a period of very low activity based on these measures. Most specifically, readings below 20 indicate ranging conditions that make spinning your wheels a more successful approach to capturing gains than riding recent uptrends or downtrends.
In simpler terms, the ADX suggests that we are moving from a phase where it was easier and more profitable to simply be long and let winners run, to a phase where it is more beneficial to focus on specific intraday levels and not worry about missing an “up move” if it doesn’t come back to you.
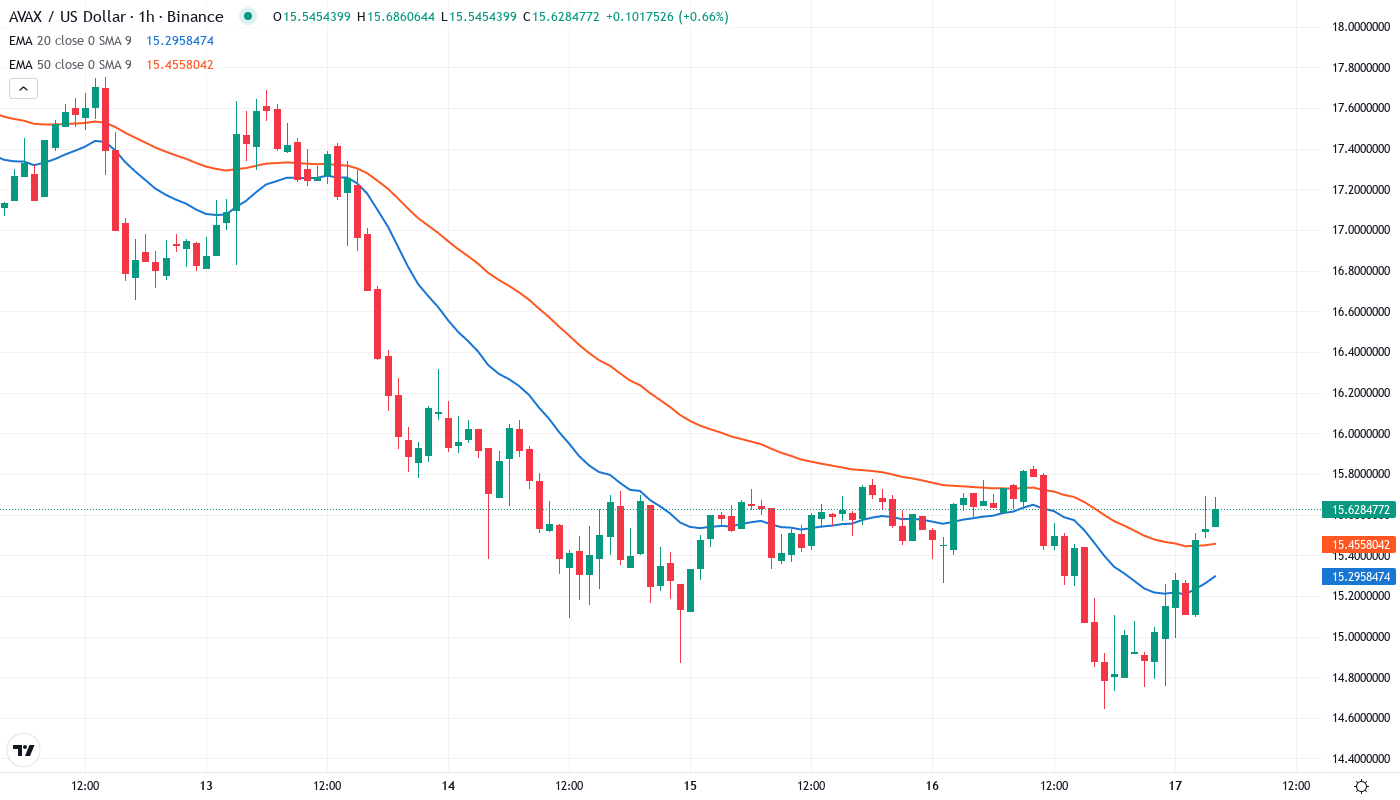
20-Day EMA at $17.24 Gates Recovery After Three Failed Attempts
The recent volume profile lacks directional conviction with a slight propensity of distribution volume nodes (VPVR). The most autonomy can be seen below in the low $15’s with a minor spike volume node at $14. This suggests trading could fall to $14 if stopped out below the range low at $15.50. Renewed interest opens ascending volume nodes all the way to $20 signaling the potential for a fast move if we find some momentum.
What is notable here is the 50-day EMA turned upside down from support to resistance, after protecting the price level in the early fourth quarter. The former $18.36 support becomes the red line that the bulls must regain in order to change the intermediate trend. In addition to the launch of yield opportunities via SIERRA acting as a fundamental trigger for such a reclaim, new capital flows lead to technical breakouts above important moving averages.
Support Architecture Builds Between $14.64 Weekly Low and $13.61 Monthly S1
There is strong resistance between the $20 psychological level and the 100-day EMA at $20.16, combined with the monthly pivot ($22.07) and R1 ($23.22). These resistance points have turned back price action on three separate occasions since November and will be a solid ceiling. Furthermore, this is the zone of pre-crash consolidation. Being named a top 2025 candidate along with those protocols using Zero Knowledge Proof will give that ceiling even more backing.
Bulls are guarding several support levels, among them the weekly low of $14.64 has been the most critical as it also coincides with the monthly S2 at $13.62 and is a 55% retrace of the yearly top. The confluence lured buyers in hard, as can be seen by the quick rebound and rising volume. The activation of Avalanche’s pre-consensus tech on eCash confirms the solid support at these levels.
The current configuration is reminiscent of a classic accumulation phase in a textbook where smart money is building up positions at multi-month lows while retail is panicking out of positions. The spread between the current price ($15.66) and the 200-week exponential moving average at $23.22 is almost 50% of the latter, which indicates either an extended period of base-building is necessary or the possibility of a very violent mean reversion rally with the right catalysts coming into play.
Bulls Require Decisive Close Above $17.24 to Confirm Reversal
If the price is able to rise above the 20-day EMA, which is currently $17.24, and there is enough trading volume to support that, it will indicate a strong bullish trend in the market. The first resistance level in that case will be the 50-day EMA, which is $18.36, followed by a push towards the $20 level. The increase in the ecosystem size due to increased RWA integration and new yield mechanisms is the kind of fundamental catalyst that can facilitate this type of price action, and demand for exposure to blockchain technology facilitated by high-liquidity systems will only increase this effect.
If AVAX bulls can maintain the $13.61 yearly level on a break of $14.64, the recent September monthly high at $17.33 becomes an immediate upside target. A return to the 5-week moving average dynamic resistance (20 week MA) during the first week in October would suggest a lower probability monthly high retest, implying institutional selling pressure may resume.
Considering the oversold bounce from important support, declining selling pressure according to the ADX, and various fundamental drivers that have entered the market at the same time, the most likely short-term outcome is that AVAX will consolidate in the $14.64-$17.24 range and gather strength for a bigger upside push. The SIERRA token launch schedule and ongoing RWA integration updates will probably decide whether this consolidation breaks to the upside or the downside in the short-to-medium term.
