Avalanche Tests Critical Support as AVAX Consolidates Near $15.64
Market Pulse
- AVAX trades around $15.64, down 31% over the past month.
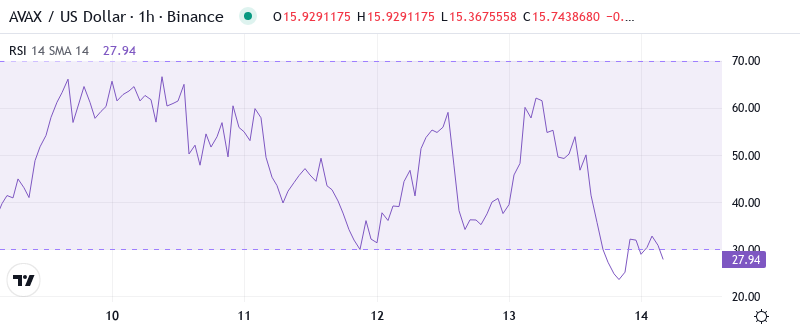
- Technical indicators suggest oversold levels nearing limits.
- The $15.02 support has held after six tests since November.
The price of AVAX has been floating around $15.64, which is a 31% decrease over the past month. However, it has managed to stay above the low levels seen during the fall. Various technical indicators are showing that oversold levels could be reaching their limits. Additionally, the $15.02 support level has held strong after being tested six times since the November drop.
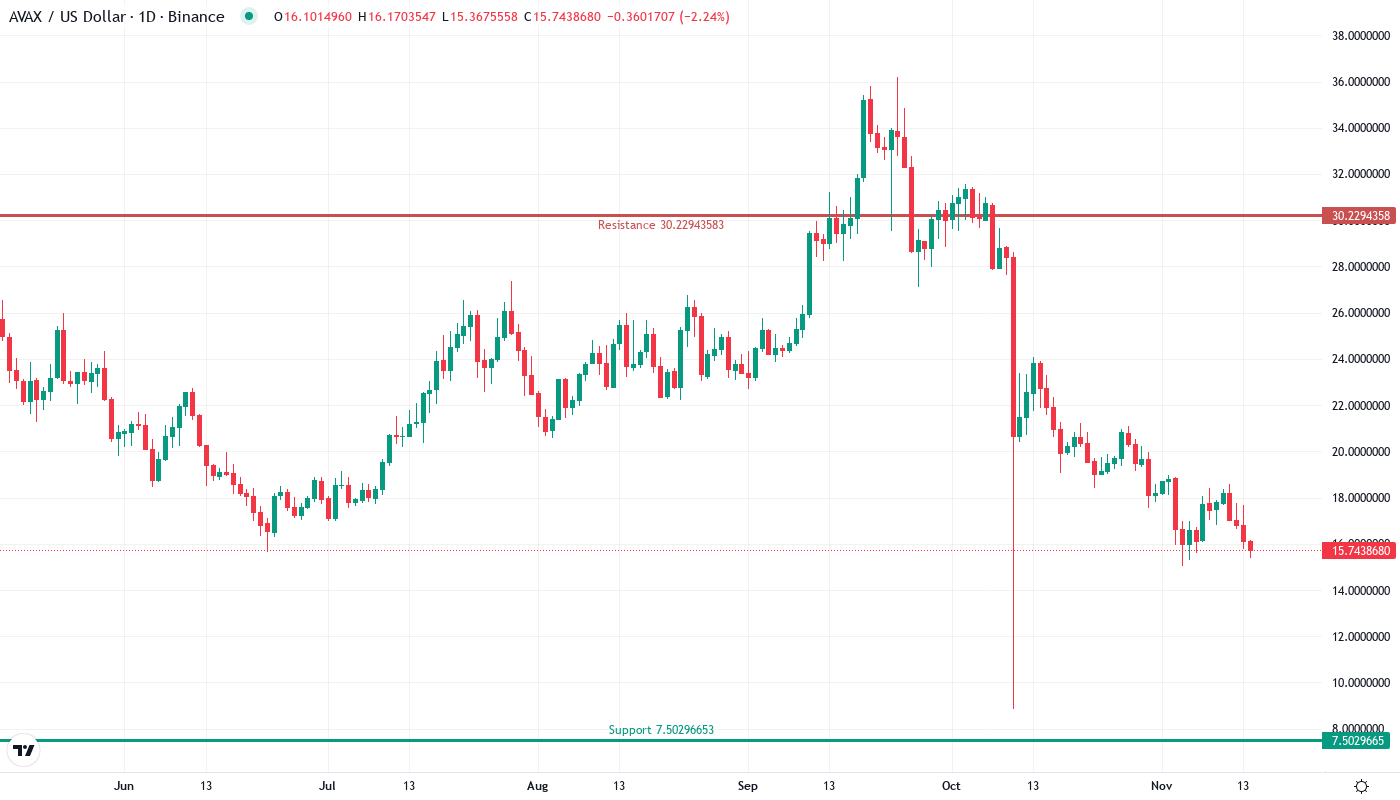
The native token of Avalanche, AVAX was trading at $15.64, down by a brutal 31.25% from its monthly peak of $22.37 as sellers took control of December’s price action. The token has dropped nearly $7 in four weeks, completely nullifying its late-summer gains, despite high-profile ecosystem updates such as Suntory’s whiskey authentication partnership and the SIERRA yield aggregator’s yield vault model launch. For traders, the key question remains: Can AVAX maintain the critical $15 support area that has been in place since November, or will resurgent selling activity cause the final barrier to crumble?
| Metric | Value |
|---|---|
| Asset | AVALANCHE (AVAX) |
| Current Price | $15.64 |
| Weekly Performance | -3.18% |
| Monthly Performance | -31.25% |
| RSI (Relative Strength Index) | 33.3 |
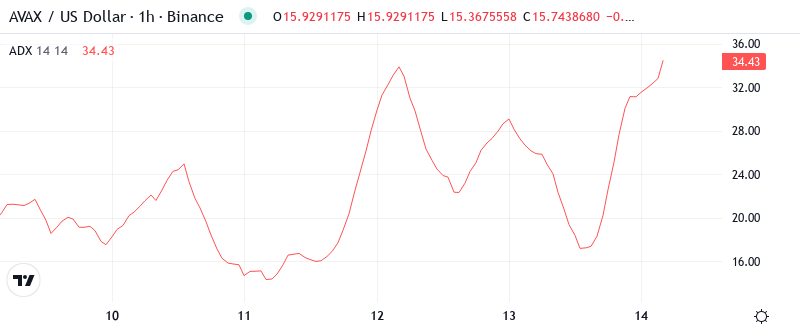
| ADX (Average Directional Index) | 50.3 |
| MACD (MACD Level) | -1.48 |
| CCI (Commodity Channel Index, 20-period) | -122.84 |
RSI at 34.85 Signals Oversold Territory – First Time Since August Collapse
With AVAX currently overtaking SOL for the honor of biggest laggard, down 50% from October’s all-time high, eyes are on the recent local low of $47.25, which has so far failed to attract retailer capitulation. Should $47 give way to the unflinching sell pressure, the subsequent wick could be brutal.
What stands out is how RSI reacted during the most recent pullback from $22.37. When we had our November face-melter to $5.50 the weekly RSI hit as low as 28. This go-around, we have had a much more measured pullback, with the RSI never falling below 32 until this week. Therefore, for swing traders, this measured oversold reading, coupled with AVAX’s increasing real-world applications via partnerships like Suntory, would imply exhaustion to the sell-side as opposed to wide-spread panic dumping.
ADX at 50.25 Shows Extreme Trend Strength – Highest Reading in Six Months
The broader perspective highlights this pullback as a potentially attractive opportunity to get involved, especially if bearish sentiment becomes over-extended. At this point, AVAX remains mired in a longer-term downtrend and has yet to establish near-term support that convinces the market a bottom has been put in place.
In simple terms, when ADX goes above 50, markets often see very strong reversals or short-term consolidation before the prevailing trend resumes. The previous occasion in which Avalanche saw ADX breach 50 was during the May capitulation below $20, which was followed by two months of sideways price action. As such, day traders can expect greater volatility as this extreme reading usually comes when the most significant supports are being tested – in this case, right where AVAX is currently located at the $15.02-$15.64 area.
Price Trapped Below Entire EMA Ribbon Since Breaking $20 Support
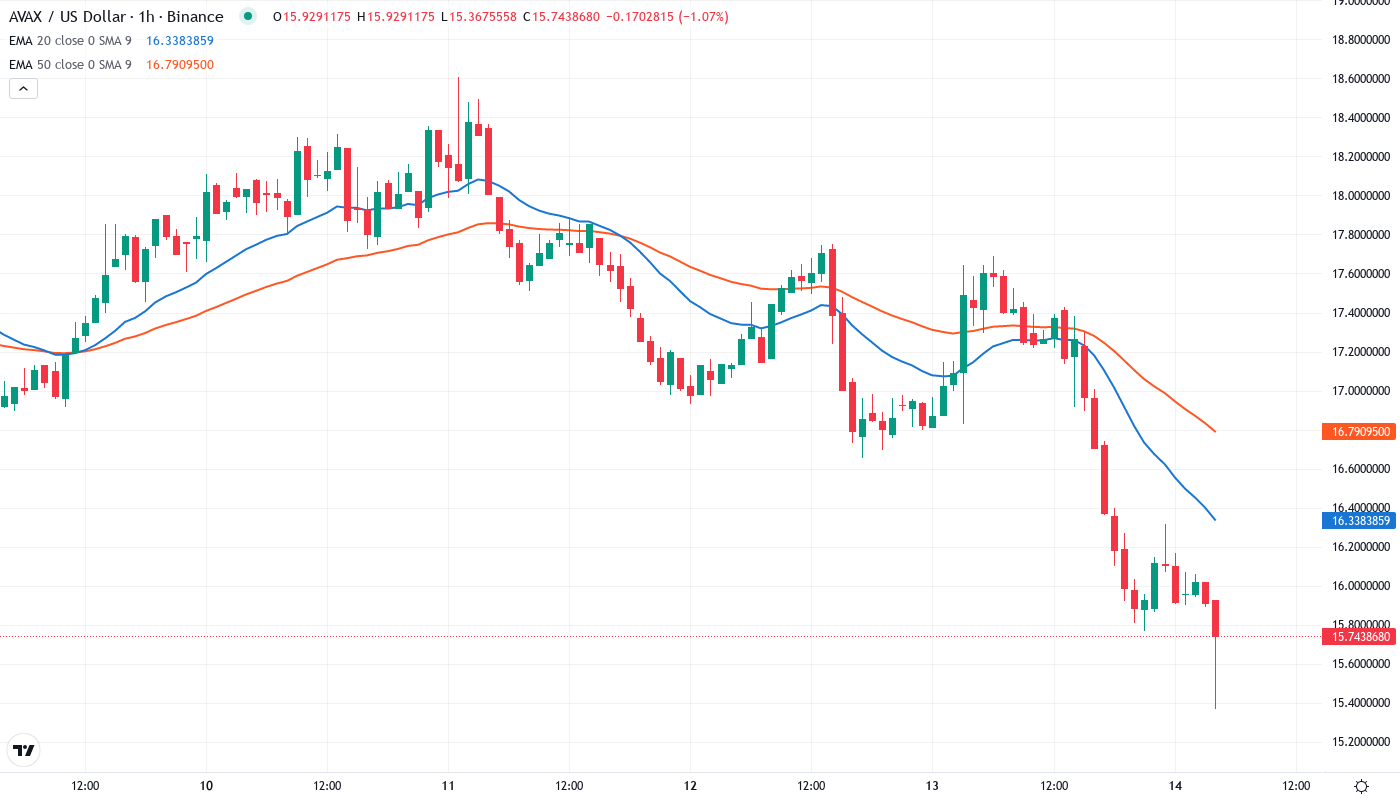
Analyzing the moving average structure indicates that bearish control is maintained on all time frames. AVAX is currently trading below the 10-day ($16.93), 20-day ($17.92), 50-day ($20.78), and most importantly, the 100-day EMA ($22.49). The 50-day EMA ($20.78) is now serving as strong resistance as it capped three rallies in December, one of which was the announcement of the SIERRA token launch.
What is more indicative is that the 10-day and 20-day EMAs are less than $1 apart. This indicates the short-term averages are in a tight position. Also, with the nearest EMA being 7% below price action, it suggests bears are in control even when the markets are in the oversold region. This dynamic support-turned-resistance level is currently positioned at $17.92. It became a dynamic support level in early December with each relief rally capping it as a ceiling. This will be the initial overhead resistance that bulls would have to surmount to change the short-term momentum.
Support Architecture Builds From $15.02 Monthly Low to $13.61 Pivot
Bulls are trying to defend various support points, including the first support at $15.02, December’s monthly low, which has blocked six downward price manipulations in the last three weeks. This level looks more solid because of the 78.6% Fibonacci retracement of the upswing to $17.47 in 2024.
There are strong resistance levels between the stock’s current price and the 10-day EMA, which is $16.93. There are more resistance levels at the monthly pivot of $18.14, and the $20 mark, where the 50-day EMA is situated. The monthly R1 pivot of $22.51 almost exactly coincides with the 100-day EMA to create a double resistance top that the bulls would struggle to penetrate.
The market structure shows a downward channel pattern since the November high, with consecutive lower highs hit at $20.78, $18.56, and $17.28. This indicates orderly distribution as opposed to capitulation, especially with volume still 18% under the 10-day average despite the sizable drop in price. The next notable support beneath us is $13.61, the monthly S1 pivot, last check back in October.
Bears Need Break Below $15.02 to Target $13.61 Support
If AVAX can recover the 10-day EMA close to $16.93, then the bulls will try to push price to the 20-day EMA at $17.92. A breakout of this resistance will be the first sign that the downtrend could be ending. The bears are likely to defend this level aggressively but if the bulls can overcome them, the momentum could carry the price to $20.
If the bearish momentum accelerates, the RSI could breach into its bearish territory, risking a sharp extension of the fall towards the $15 psychological number drawn from November 2020. More losses may then send the price towards the 23.6% Fibonacci retracement of the up leg from $1.60 to $60.90 at $10.70 before the focus shifts to the July 2021 low of $9.50.
Because RSI still has to work off overbought readings, AVAX could test the level of support at the 200 four-hour SMA (currently at $15.29), adding the 50 four-hour SMA at $15.02 and 23.6% Four-Day Correction at $14.75.