Avalanche Tests Critical Support as Abu Dhabi Foundation Sparks Institutional Interest
Market Structure Shifts Higher
- AVAX consolidates at $13.58 after establishing a DLT foundation in Abu Dhabi’s global market
- Inclusion in Bitwise’s NYSE-listed crypto index ETF boosts institutional visibility
- Technical indicators suggest momentum building from oversold conditions
Avalanche trades at $13.58, holding steady after a challenging period that saw the token slide 20.26% over the past month and 28.34% across six months. The establishment of a DLT foundation in Abu Dhabi Global Market arrives as AVAX tests multi-month support levels, with the strategic move designed to attract institutional partnerships and investment flows into the ecosystem. The main question for traders is: can this fundamental catalyst provide the spark needed to reverse the technical downtrend?
| Metric | Value |
|---|---|
| Asset | AVALANCHE (AVAX) |
| Current Price | $13.58 |
| Weekly Performance | -5.79% |
| Monthly Performance | -20.26% |
| RSI (Relative Strength Index) | 43.2 |
| ADX (Average Directional Index) | 33.2 |
| MACD (MACD Level) | -0.60 |
| CCI (Commodity Channel Index, 20-period) | -52.58 |
RSI Rebounds From Oversold Territory – Bulls Defend Key Zone
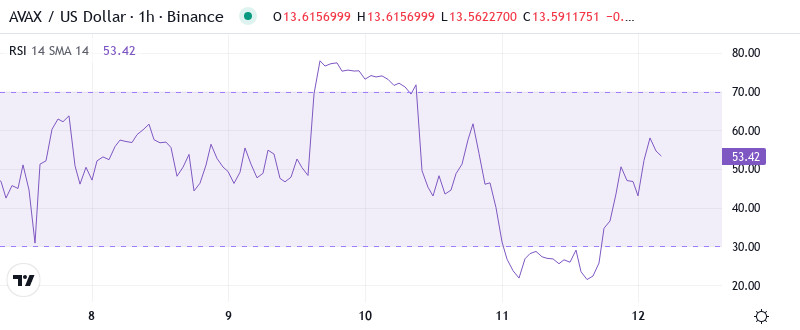
Reading at 51.46 on the daily timeframe, RSI signals a recovery from oversold conditions that dominated December’s price action. This neutral positioning reflects the tug-of-war between sellers who drove the recent decline and buyers emerging at these compressed levels. The oscillator’s climb from sub-30 readings mirrors the pattern seen in September before AVAX staged a 40% relief rally.
For swing traders, this RSI reset creates opportunity in both directions. The momentum indicator shows neither exhaustion nor euphoria – just equilibrium after the washout. With the Abu Dhabi foundation news providing fundamental support, any sustained push above RSI 55 would confirm bulls are gaining control of the narrative.
ADX at 33.22 Confirms Trend Strength Building From Compression
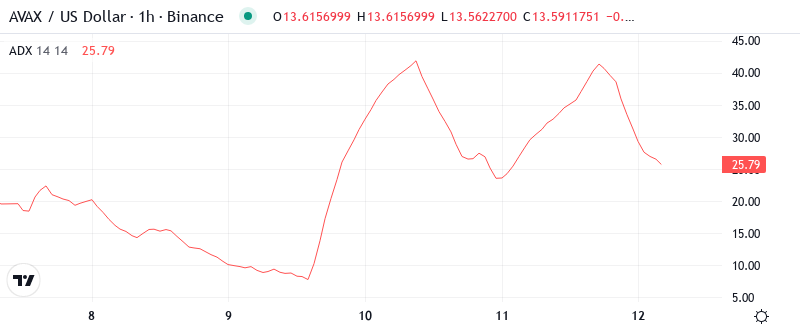
At the level of 33.22, the ADX reading indicates genuine directional movement emerging from weeks of choppy consolidation. The trend strength metric climbed sharply from the low 20s, signaling the market is transitioning from range-bound conditions into a trending state. Basically, this shift means volatility expansion is underway.
Day traders should adjust strategies accordingly – the days of ping-ponging between tight ranges are ending. When ADX crosses above 30 like this, it typically marks the beginning of a sustained directional move. The inclusion in Bitwise’s ETF product adds institutional flow dynamics that could amplify this trend acceleration in either direction.
20-Day EMA at $14.13 Becomes First Resistance Target
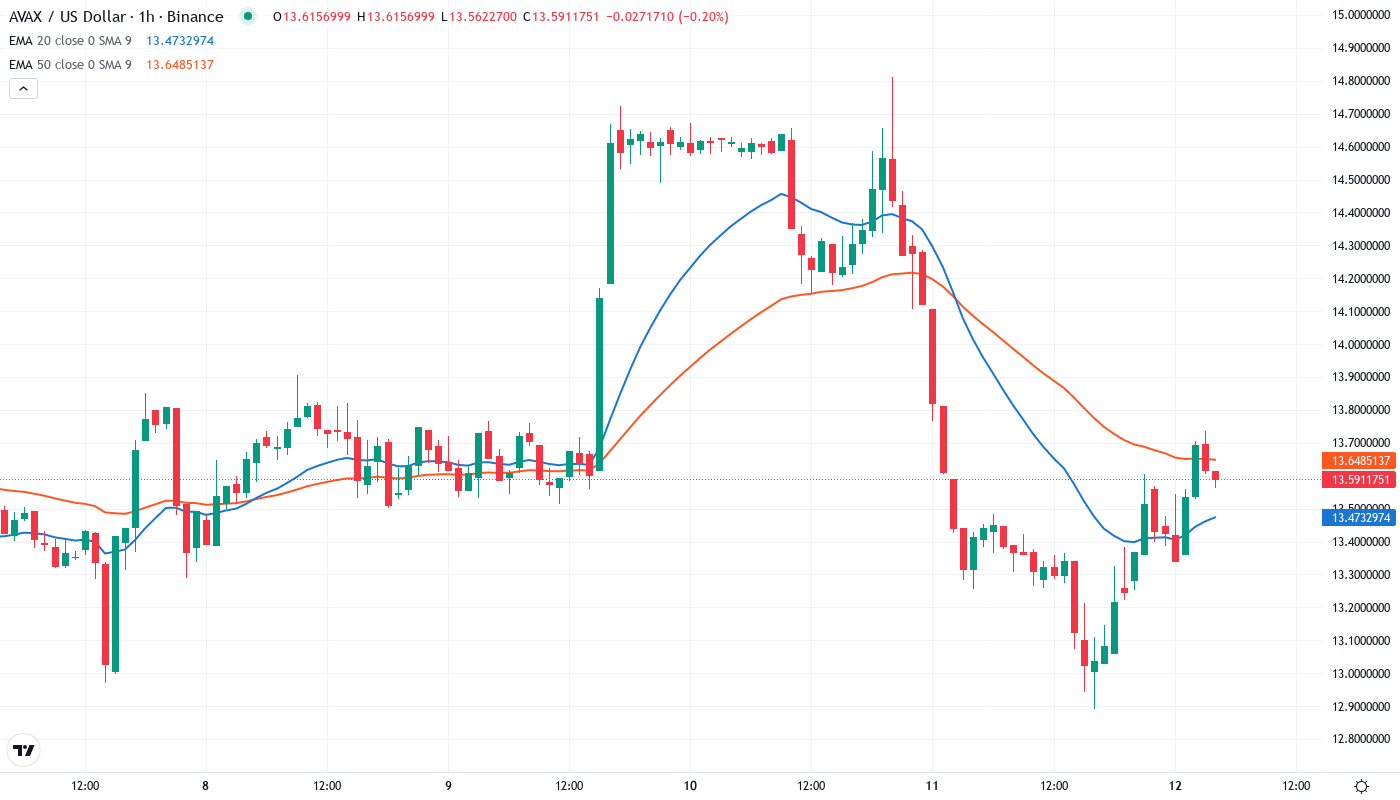
Price action reveals AVAX trading below the entire EMA ribbon, with the nearest resistance at the 20-day EMA ($14.13). The 50-day EMA sits higher at $16.19, while the 200-day EMA at $21.16 remains distant overhead resistance. This stacked configuration shows bears maintain structural control despite the recent bounce attempt.
What’s significant is how the 20-day EMA flipped from support to resistance during December’s slide. Bulls need to reclaim this level convincingly to shift near-term momentum. The convergence of the 10-day ($13.82) and 30-day ($14.72) EMAs creates a resistance cluster between $13.80-$14.75 that will likely cap initial recovery attempts.
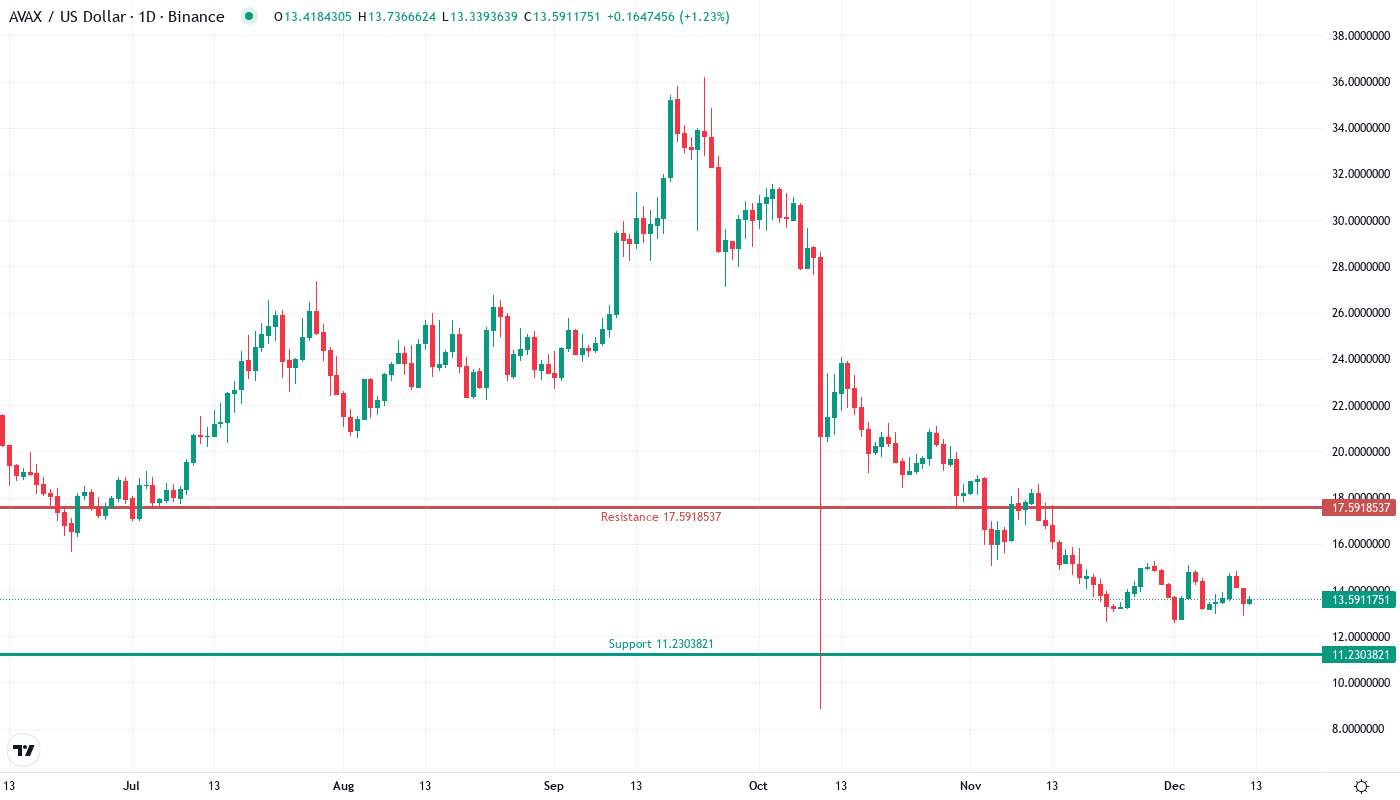
Support Stacks at $11.23 While Resistance Clusters Near $17.69
The immediate resistance zone extends from the monthly pivot at $15.11 up to December’s high at $17.69. This $15-$18 area contains multiple technical confluences including prior support levels that now act as resistance. Any advance toward these levels will face heavy supply from underwater positions looking to exit.
On the support side, AVAX has established a multi-touch floor at $11.23, which aligns with the monthly S1 pivot. This level held during the recent selloff and represents the line in sand for bulls. Below that, the psychological $10 level and monthly S2 at $8.75 offer deeper support zones, though losing $11.23 would signal continued distribution.
The market structure shows buyers defending lower levels while sellers guard the overhead supply zones. This compression between $11.23 support and $17.69 resistance resembles a coiled spring, with the Abu Dhabi foundation news and ETF inclusion potentially providing catalysts for directional resolution.
Bulls Need Daily Close Above $14.13 to Confirm Recovery
For the bullish scenario to materialize, AVAX must secure a daily close above the 20-day EMA at $14.13. Such a move would flip the first resistance level to support and open the path toward $16.19. The combination of institutional interest from the Bitwise ETF listing and Abu Dhabi foundation development provides fundamental fuel for this recovery attempt.
Bears regain control if price rejects at current levels and breaks below $11.23 support on volume. This would trap recent bottom-fishers and likely trigger stops down to the psychological $10 level. A failure to hold $11.23 after the positive news flow would signal deeper structural issues requiring attention.
Given the technical setup and fundamental catalysts, the most probable near-term path sees AVAX consolidating between $11.23-$14.13 while digesting the Abu Dhabi news. The ETF inclusion should provide consistent bid support, making a gradual grind higher toward the 20-day EMA the base case scenario over the coming sessions.