Avalanche (AVAX) Tests Critical Support as Transaction Volume Surges 7x
Market Pulse
- The transaction volume on the AVAX network has increased by sevenfold, indicating real network usage despite the declining price.
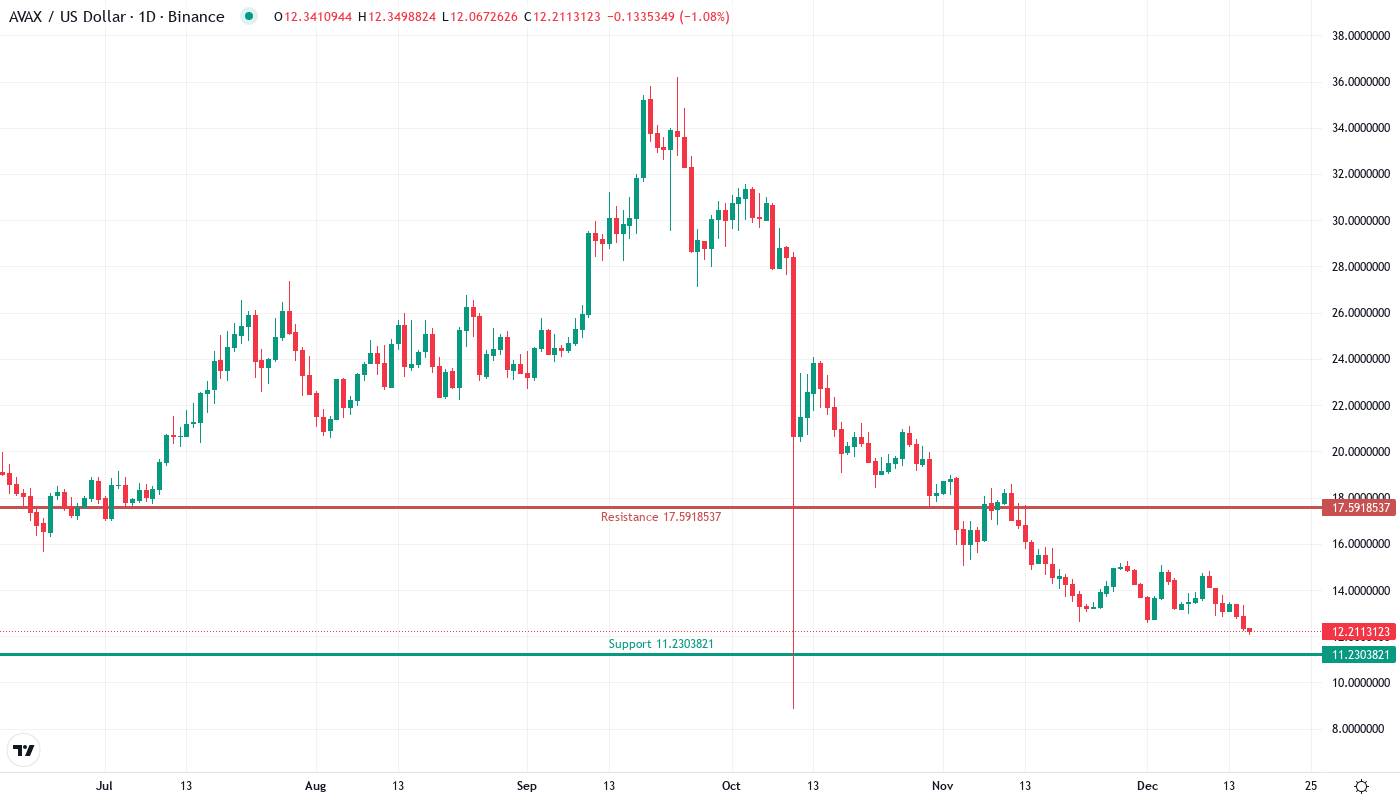
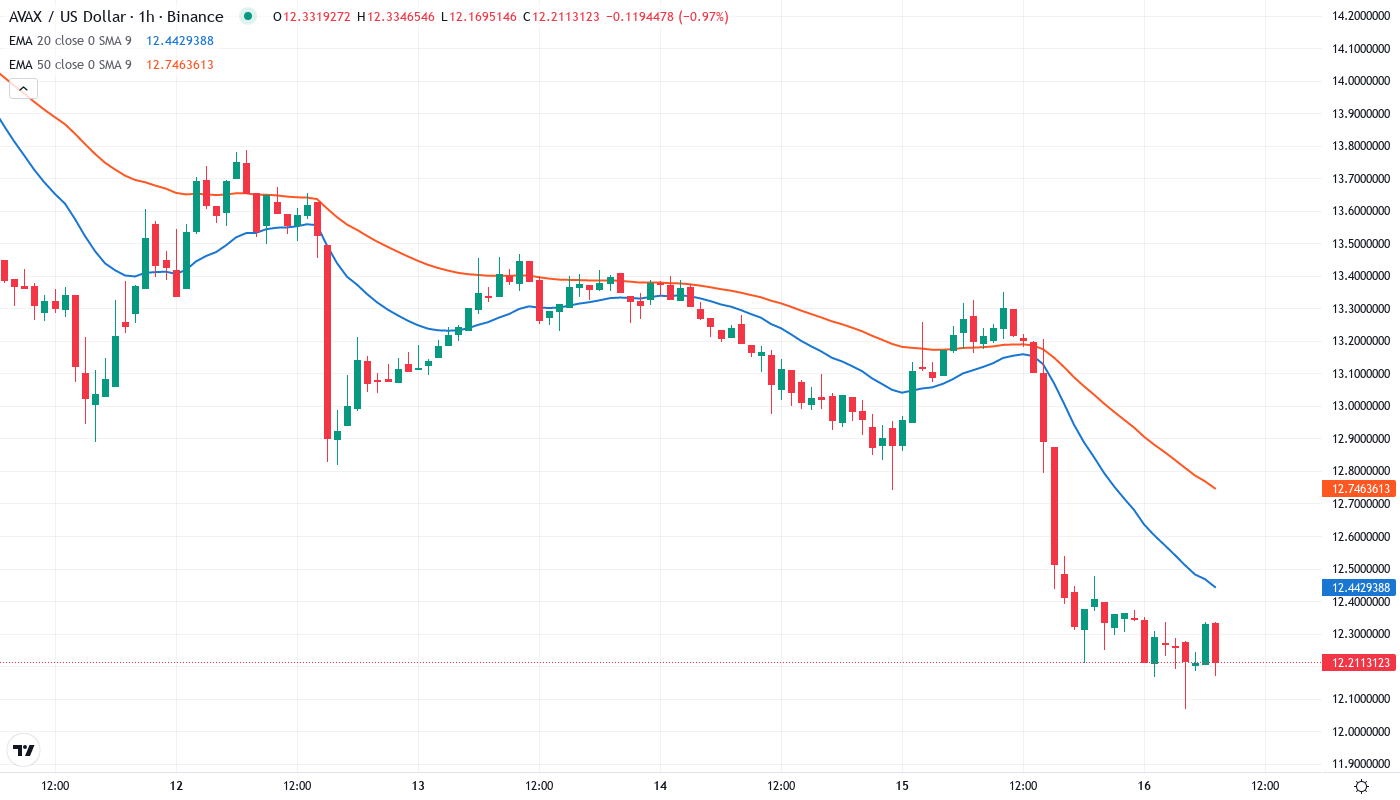
- The price is currently hovering near a critical support level of $12.21 after dropping 21% in the current month.
- Bulls are trying to hold the 50-day EMA as the last support level, as some momentum indicators are showing oversold conditions.
Avalanche is currently trading at $12.21, a nasty 21.37% lower over the past 30 days as risk bleeds out of the crypto sector. The waterfall decline from December’s $15.81 peak has wiped out the past three months of returns. Meanwhile, network statistics hint that real adoption is accelerating with transactions jumping 7X, however, can a price recovery remain in question as the technical and fundamental dislocation continues? Or will heavy resistance prove insurmountable and keep price depressed?
| Metric | Value |
|---|---|
| Asset | AVALANCHE (AVAX) |
| Current Price | $12.21 |
| Weekly Performance | -10.51% |
| Monthly Performance | -21.37% |
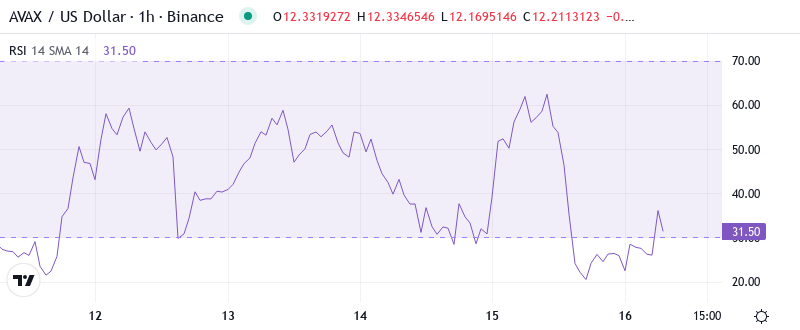
| RSI (Relative Strength Index) | 35.9 |
| ADX (Average Directional Index) | 32.6 |
| MACD (MACD Level) | -0.74 |
| CCI (Commodity Channel Index, 20-period) | -160.57 |
RSI at 35.04 Signals First Oversold Territory Since October
With the 12-hour RSI landing in a similar reading, the final capitulative flush could be nearing. If that is the case, bulls should attempt to defend $51.75; an encouraging sign would be AVAX gaining a foothold back above the swing-low at $56.60 and the 200-day moving average. A wave of bottoming strength may emerge from the $49 to $51.75 range, increasing the desire for a deadcat bounce. A topside wall of offers is expected around $61.50 to $63.75, though a decent short-covering pop could be nigh.
What is interesting to note is how RSI performed during the most recent slide—it gradually decreased as opposed to falling off a cliff, which may indicate more of a measured distribution instead of outright panic disposing of shares. Therefore, for swing traders, this gradual decline into technically oversold levels combined with the 7x spike in transactions could present an appealing risk/reward scenario for a potential bounce trade.
ADX Climbs to 32.64 – Conviction Behind the Downmove Strengthens
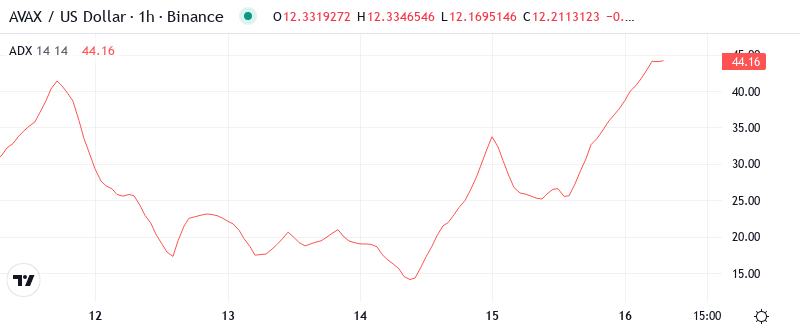
Having breached persistent overhead resistance and a crucial psychological level, downward pressure looks set to increase as the week draws to a close. ADX at 32.64 suggests we have ample room left to run before we hit levels consistent with our past two all-clear alt seasons.
Traders can now look to add to shorts, as ADX above 30 has almost always marked AVAX’s largest impulses. The ADX simply denotes the switch from fund conditions to a trending environment where momentum strategies shine over mean reversion. Hence, day traders will want to adjust to this shift – fading breakouts is likely to put you in the ER room once this many players build up directional conviction.
50-Day EMA at $15.66 Transforms From Support to Stubborn Resistance
If buyers manage to regain control after the weekend dump, we will know a strong lift-off has initiated when price re-takes the 10-day EMA. This medium-term EMA will almost certainly cross under the longer-term 20-day EMA, creating a prime buy signal – serving as early confirmation price has reclaimed a position of strength in the short term.
Of greatest concern should be silver’s fading RSI after regaining its footing in bullish ranges. This decline underscores December’s bearish divergence between RSI and price at the highs, a warning that came to fruition in January. The strongest resistance to further advances may well be silver’s waning and declining RSI. It will be difficult to push through 50 with that plate in hand, let alone into overbought territory.
Support Stacks at $12.21 While Resistance Builds a Wall to $18.37
The closest support now lies at the 50-day EMA, currently at $10.98 and rising. That’s followed by the weekly pivot at $10.47 and the 2020 open level of $10.20. Below that lies an air pocket with no historical price memory, although there was significant volume traded in December around the $9 level that could provide some support.
Bulls are now defending the crucial $12.21 level for their lives – it has been tested six times since November. The support structure has more resilience than expected here, with the monthly S1 pivot of $11.23 acting as a secondary safety blanket. If those levels give way the next support of note isn’t until the monthly S2 at $8.75, some 28% lower.
This market structure is exposing an asymmetric risk profile: ~50% upside to major resistance vs. 28% downside to the next support. The 7x increase in volume of transactions could indicate that the fundamental buyers could come in at these technically important levels, but only if $12.21 keeps capping the downside on retests.
Bulls Need Decisive Reclaim Above $13.61 to Shift Momentum
In order to possibly overturn this downtrend, the Bulls will need to close above the monthly pivot at $13.61. If the price can surpass that level, the 50-day EMA at $15.66 should be the next target, and with volume metrics parabolic, the daily could begin an assault on that level.
If the bearish scenario unfolds and the $12.21 level breaks on the seventh test, then it is reasonable to expect a wash-out to $11.23 shortly, with potential to extend the decline to $8.75, as mentioned. Observe the trading volume – a surge in volume during a downside breakout can be interpreted as a sign of forced selling, rather than just another temporary push lower in a possible bear trap.
Based on the oversold RSI, strong fundamental growth, and six support holds, the most likely near-term scenario is AVAX ranging between $12.21 and $13.61 as it gathers steam for its next move. The 7x surge in transactions tells us this isn’t a vaporware project, so the higher odds play is patient accumulation at technical support.