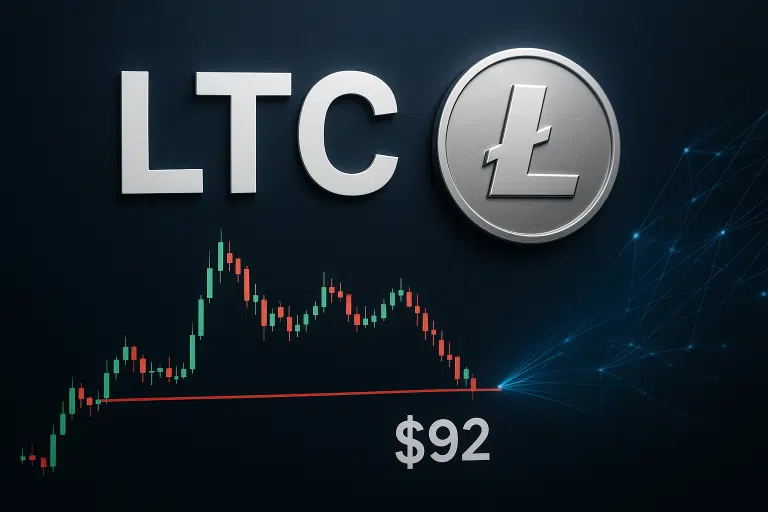
Litecoin Tests Critical Support at $92 as Hashrate Surges 117%
Litecoin tests critical support at $92 as hashrate surges 117%, indicating potential undervaluation. Market structure shifts higher with LTC hovering at $92.33. Despite a 20% monthly drop, signs of stabilization and miner confidence suggest potential for a bounce from $80 support. Technical indicators point to a consolidation phase before the next directional move.