Skip to content
DeepChainy
  • Crypto Price Analysis
DeepChainy
  • A large gold coin embossed with the Pepe frog face and the word PEPE, surrounded by smaller gold coins, set against a faint rising line chart in the background.
    Crypto Price Analysis

    PEPE Consolidates Near Multi-Month Lows as Whale Accumulation Signals Potential Bottom

    BySimon Black November 17, 2025

    PEPE consolidates near multi-month lows as whale accumulation signals potential bottom. Market structure shifts lower with technical indicators flashing oversold extremes. Retail capitulation meets institutional accumulation as smart money bets on reversal. The meme coin trades at $0.00000499, down 76.6% from yearly highs.

    Read More PEPE Consolidates Near Multi-Month Lows as Whale Accumulation Signals Potential BottomContinue

  • Monero cryptocurrency logo in front of a white grid chart with a red descending line and arrow pointing down toward the $400 label.
    Crypto Price Analysis

    Monero Tests Critical $400 Support as Regulatory Headlines Intensify Selling Pressure

    BySimon Black November 17, 2025

    Monero tests critical $400 support as regulatory headlines intensify selling pressure, plunging 38.6% from monthly highs. Bulls defend psychological $400 level but face resistance from $440 to $477. Can they hold key support or will regulatory uncertainty push XMR lower to $301?

    Read More Monero Tests Critical $400 Support as Regulatory Headlines Intensify Selling PressureContinue

  • Toncoin blue logo beside bold “TON” text above a price chart showing green gains shifting to red losses as the line breaks below a dotted “CRITICAL SUPPORT” level.
    Crypto Price Analysis

    Toncoin Tests Critical Support as Coinbase Listing Roadmap Sparks Volatility

    BySimon Black November 17, 2025

    Toncoin’s price action tells a tale of two catalysts colliding – the promise of Coinbase listing visibility meeting the reality of $66.95 million in token unlocks flooding the market. The cryptocurrency dropped 13.08% over the past week to $1.834, with selling pressure intensifying as newly unlocked tokens hit exchanges just as institutional interest peaked through CoinShares’ new ETP launch. The main question for traders is: can the $1.75 support level that’s held since November survive this perfect storm of supply pressure and technical breakdown?

    Read More Toncoin Tests Critical Support as Coinbase Listing Roadmap Sparks VolatilityContinue

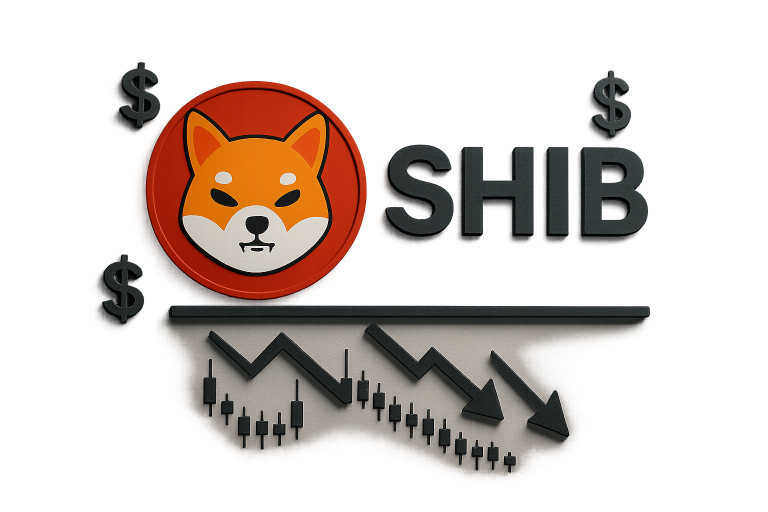
  • Shiba Inu cryptocurrency logo alongside bold “SHIB” text on a grid background, featuring a horizontal support line and a zigzag arrow trending upward to indicate price movement
    Crypto Price Analysis

    SHIB Tests Critical Support After Unity Nodes Deal Sparks Real-World Utility Push

    BySimon Black November 17, 2025

    Shiba Inu tests critical support at $0.00000904 after Unity Nodes partnership announcement fails to stop December decline. Price down 9.5% weekly, extending 63% yearly drop. Integration allows SHIB payments in $2 trillion telecom sector, signaling shift from meme coin to utility token. Traders watch for stability in real-world utility push.

    Read More SHIB Tests Critical Support After Unity Nodes Deal Sparks Real-World Utility PushContinue

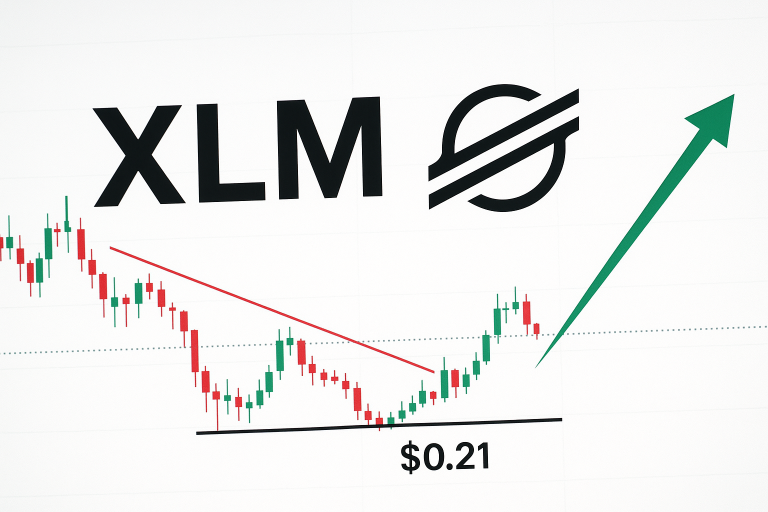
  • Stellar (XLM) logo above a candlestick price chart testing the $0.258 support level, with a dashed horizontal line and upward arrows highlighting bullish momentum.
    Crypto Price Analysis

    XLM Tests Critical Support at $0.258 as Tokenization Momentum Builds

    BySimon Black November 17, 2025

    XLM Tests Critical Support at $0.258 as Tokenization Momentum Builds. Stellar trades at decade-low support while institutional tokenization projects accelerate. RSI momentum completely reset, creating reload opportunity. Six-time tested $0.172 floor emerges as final defense for bulls. Stellar has endured a 37.8% decline over three months.

    Read More XLM Tests Critical Support at $0.258 as Tokenization Momentum BuildsContinue

  • Red Avalanche (AVAX) coin with white tri-fold logo placed over a green and red candlestick price chart, accented by upward and downward arrows and “AVAX” lettering beneath.
    Crypto Price Analysis

    Avalanche Tests Critical Support as SIERRA Launch Sparks Ecosystem Interest

    BySimon Black November 17, 2025

    Avalanche tested critical support levels as the SIERRA launch sparked ecosystem interest, leading to a market structure shift higher. AVAX bounced off six-month lows near $14.64, now trading at $15.66. Institutional interest surged with RWA adoption, Chainlink, and Hedera. The new SIERRA token yield model introduces fresh capital incentives.

    Read More Avalanche Tests Critical Support as SIERRA Launch Sparks Ecosystem InterestContinue

  • Graphic depicting the ALGO logo over a dark candlestick chart, with a red arrow plunging to a support line then a green arrow rebounding above $0.157.
    Crypto Price Analysis

    ALGO Faces Crucial Test at $0.157 as Bulls Guard Six-Month Support

    BySimon Black November 16, 2025

    Algorand price action shows resilience amid adversity, dropping 14.95% over the past month but defending critical $0.157 support level. Bullish pressure guards six-month support as technical indicators reset. Will recent security innovations and ISO 20022 adoption be enough to break downtrend?

    Read More ALGO Faces Crucial Test at $0.157 as Bulls Guard Six-Month SupportContinue

  • VeChain V logo and VET symbol in front of a descending candlestick chart and large red down arrow, illustrating price testing critical support around $0.015.
    Crypto Price Analysis

    VeChain Tests Critical Support at $0.015 as Bears Press Monthly Lows

    BySimon Black November 16, 2025

    VeChain dropped 13.4% this week, pushing price to test crucial $0.015 support. Technical indicators flash oversold signals matching August’s capitulation levels. Bulls defend multi-month support zone despite heavy selling pressure.

    Read More VeChain Tests Critical Support at $0.015 as Bears Press Monthly LowsContinue

  • Crypto.com (CRO) logo with a red jagged downward arrow overlaying a faded declining price chart and bold “-22.8%” figure.
    Crypto Price Analysis

    CRO Plunges 22.8% Monthly Despite Trump Media Deal – Technical Structure Deteriorates

    BySimon Black November 16, 2025

    Cronos (CRO) has experienced a devastating drop of 22.8% over the past month, currently trading at $0.1139 despite the buzz surrounding its integration into Trump Media’s prediction market venture on Truth Social. The partnership announcement initially sparked an 11.5% surge, but sellers quickly overwhelmed any buying enthusiasm, pushing price down to test the psychological $0.11 level. The main question for traders is: can this heavily oversold bounce find legs, or will the bearish momentum continue toward the next major support at $0.0835?

    Read More CRO Plunges 22.8% Monthly Despite Trump Media Deal – Technical Structure DeterioratesContinue

  • APT logo alongside a green upward-trending arrow chart showing +5.20% and +14.45% gains, with stacks of coins symbolizing a price rebound and network revival.
    Crypto Price Analysis

    Aptos Climbs From 6-Month Lows as Stablecoin Surge Signals Network Revival

    BySimon Black November 16, 2025

    Aptos climbs 19.7% from $2.40 low, still 40% below highs. Stablecoin surge signals network revival as RSI resets to 39.9. Market structure shifts higher with momentum building. Traders contemplate genuine trend reversal or relief rally in broader bearish structure.

    Read More Aptos Climbs From 6-Month Lows as Stablecoin Surge Signals Network RevivalContinue

Page navigation

1 2 3 … 6 Next PageNext

© 2025 Crypto news at lightning speed. - WordPress Theme by Kadence WP

Scroll to top
  • Crypto Price Analysis
Search