Arbitrum Tests Critical Support as Technical Debate Intensifies Over Ethereum’s Future
Market Structure Shifts Lower
- ARB slid 10.7% this week to $0.212, extending monthly losses to 36.7%
- Technical indicators flash oversold across multiple timeframes as price probes year-long support
- Offchain Labs challenges Vitalik’s RISC-V vision with WASM alternative, sparking ecosystem debate
Arbitrum tumbled through multiple support levels this week, shedding 10.7% to close at $0.212 as the broader Layer-2 sector faced renewed selling pressure. The decline extends ARB’s monthly losses to a devastating 36.7%, with the token now down 76.6% from its yearly peak. Technical indicators have plunged into oversold territory just as Offchain Labs engaged in a high-stakes technical debate with Ethereum’s founder over the future of smart contract execution. The main question for traders is: can the $0.212 support zone hold after six months of relentless selling, or will ARB break down toward the psychological $0.20 level?
| Metric | Value |
|---|---|
| Asset | ARBITRUM (ARB) |
| Current Price | $0.21 |
| Weekly Performance | -10.68% |
| Monthly Performance | -36.72% |
| RSI (Relative Strength Index) | 35.0 |
| ADX (Average Directional Index) | 42.5 |
| MACD (MACD Level) | -0.03 |
| CCI (Commodity Channel Index, 20-period) | -71.38 |
RSI Plunges to 34.96 – Matching Levels That Marked Previous Bottoms
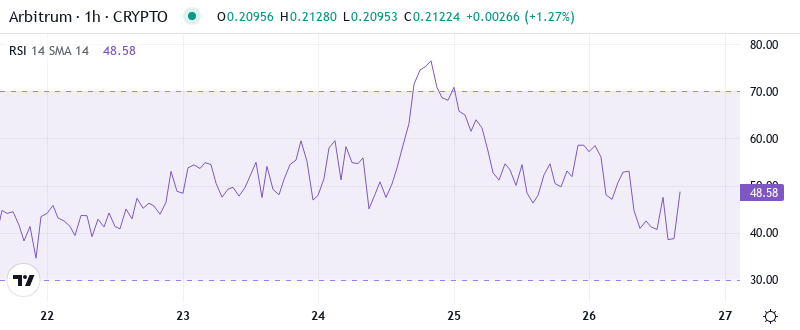
Reading the oscillator at 34.96 on the daily timeframe, traders see momentum exhaustion that historically preceded sharp reversals in ARB’s price action. Similar oversold conditions in August and October both resulted in 20-30% relief rallies within two weeks, though each bounce ultimately failed at lower highs. The weekly RSI tells an even more dramatic story at 21.12, marking the most extreme oversold reading since the token’s inception.
What’s revealing is how RSI behaved during the recent Offchain Labs announcement about their WASM counter-proposal to Vitalik’s RISC-V vision. Despite the technically bullish implications of enhanced smart contract efficiency, momentum indicators barely budged – signaling that sellers remain firmly in control regardless of fundamental developments. So for swing traders, this deeply oversold RSI suggests a technical bounce could materialize near $0.20-0.22, but any rally faces heavy overhead resistance without a catalyst strong enough to shift market structure.
ADX at 42.49 Confirms Mature Downtrend Nearing Exhaustion Point
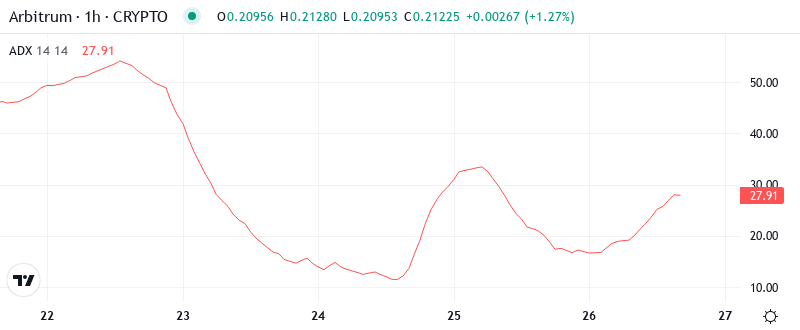
Trend strength readings paint a clear picture with ADX climbing to 42.49, well above the 40 threshold that typically marks trend exhaustion. At this level, the selling pressure has reached an intensity that often precedes either capitulation or reversal, particularly when combined with oversold momentum indicators. The ADX reading hasn’t touched these extremes since March’s washout below $0.50.
Crucially, the persistence of ADX above 40 for multiple sessions indicates this isn’t just a quick flush but rather sustained distribution. The technical debate between Offchain Labs and Vitalik over WASM versus RISC-V implementation adds an interesting wrinkle – while the discussion highlights Arbitrum’s technical leadership, it hasn’t yet translated into buying interest. Therefore, trend followers should prepare for potential volatility as this mature downtrend approaches inflection territory where explosive moves in either direction become increasingly probable.
Price Trapped Below Entire EMA Ribbon Since Early December
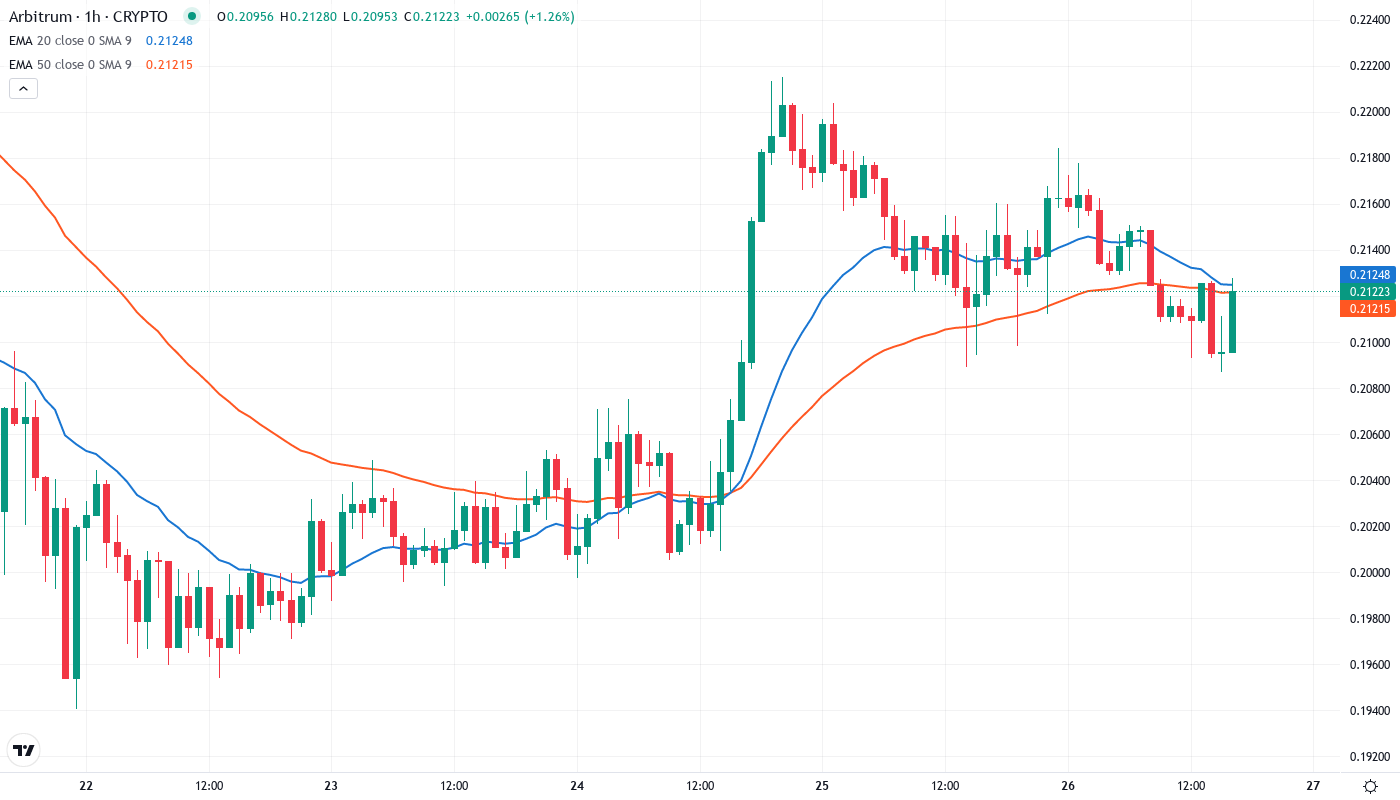
Moving average structure reveals the depth of ARB’s technical damage, with price trading below every significant EMA from the 10-day ($0.219) through the 200-day ($0.389). The 50-day EMA at $0.289 now sits 36% above current levels, transforming from support into a formidable resistance barrier that rejected December’s feeble recovery attempt. Most telling is the compression between the 10-day and 20-day EMAs, both hovering near $0.237, creating a resistance cluster just above current price.
During the past week, bulls made three attempts to reclaim the 10-day EMA but faced aggressive selling each time price approached $0.22. This repeated rejection pattern, combined with the Robinhood partnership announcement failing to spark sustained buying, suggests the moving average confluence between $0.237-$0.255 will likely cap any near-term relief rally. The 200-day EMA at $0.389 remains a distant target, requiring an 83% surge just to test long-term trend resistance.
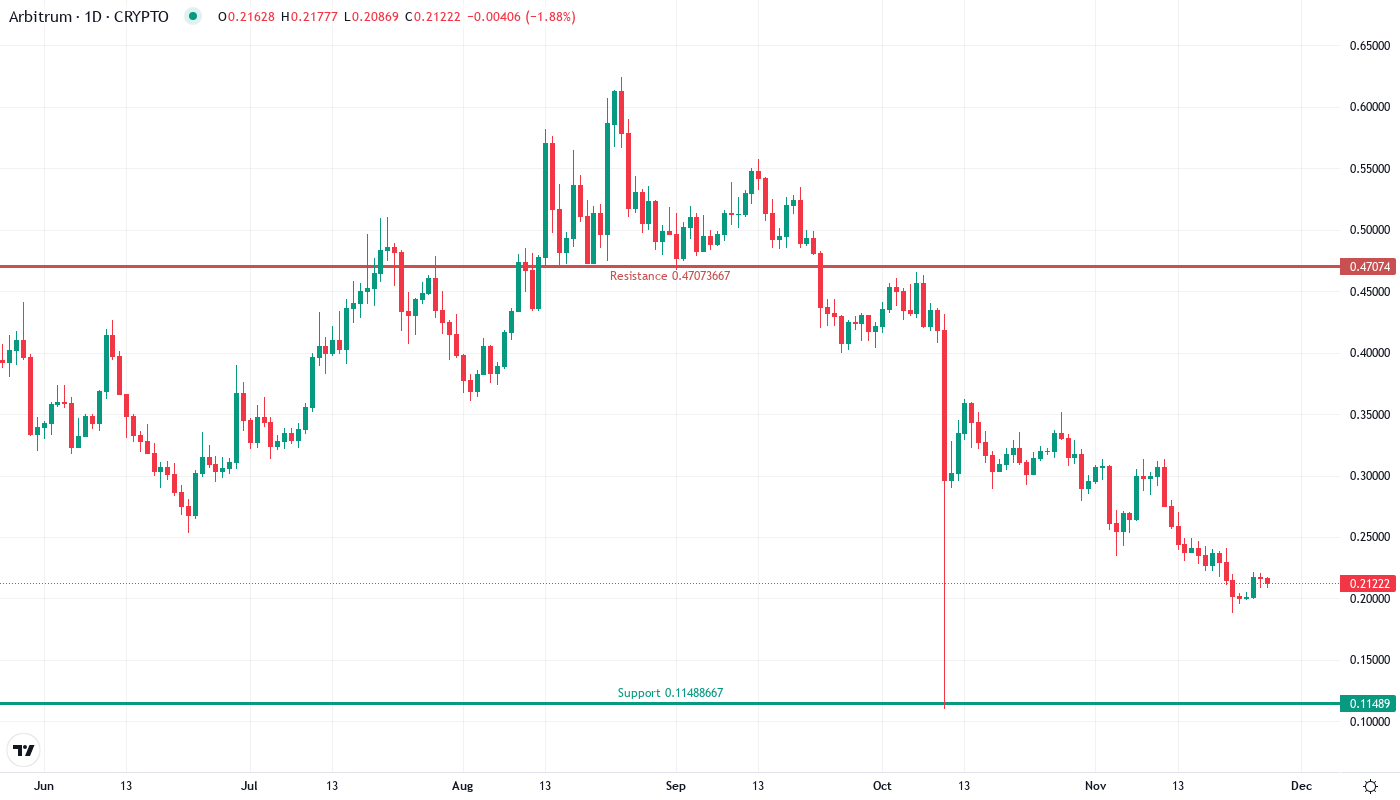
$0.212 Support Emerges as Final Defense Before Psychological $0.20
Resistance stacks heavy between the immediate $0.237 EMA cluster and December’s failed breakout high at $0.282. Above that, the monthly pivot at $0.291 aligns with the 50-day EMA, creating a double barrier that would require significant volume and catalyst to overcome. The zone between $0.282-$0.291 trapped late buyers in December and will likely see distribution on any approach.
Support architecture looks increasingly fragile with only the current $0.212 level preventing a test of the psychologically critical $0.20 mark. Below that, the monthly S1 pivot at $0.188 represents the next technical floor, though thin volume profiles suggest an air pocket could accelerate losses toward $0.15 if $0.20 breaks decisively. The weekly S3 pivot at $0.114 marks catastrophic support should broader capitulation emerge.
Market structure reveals a descending triangle pattern with lower highs since March while support at $0.212 has held through multiple tests. This compression typically resolves with a violent move matching the triangle’s height – roughly 40% in either direction. The upcoming resolution of the WASM versus RISC-V debate could provide the catalyst for this coiled spring to release, though technical damage favors downside resolution without a fundamental game-changer.
Bulls Require Daily Close Above $0.237 to Shift Momentum
Bulls need a decisive daily close above the 10/20-day EMA cluster at $0.237 to signal even a temporary momentum shift. Such a move would target the $0.282 December high, with the Offchain Labs technical innovations potentially providing narrative support for a relief rally. Volume must exceed the 10-day average by at least 50% to confirm any breakout attempt as legitimate rather than another bull trap.
The bearish scenario triggers on a daily close below $0.212, which would likely cascade toward $0.20 as stop-losses activate and late holders capitulate. Loss of the psychological $0.20 level would confirm the descending triangle breakdown, projecting a measured move toward $0.15 – representing another 29% decline from current levels. This outcome becomes increasingly probable if the WASM debate fails to generate developer excitement or institutional interest.
Given the mature downtrend, deeply oversold conditions, and critical support test at $0.212, the most likely near-term path involves a relief bounce toward $0.237-$0.255 before sellers reassert control. The technical debate between Offchain Labs and Ethereum’s core developers adds a wildcard element, but until price reclaims key moving averages, ARB remains in a confirmed downtrend with lower targets probable.