Aptos Climbs From 6-Month Lows as Stablecoin Surge Signals Network Revival
Market Structure Shifts Higher
- 20WMA starts to tick higher after a 40% reduction from Aug 13 to Dec 20.
- Weekly RSI December high (44.9) is rising and approaching a breakout.
- First higher high on the weekly chart since ATHs would end the bear trend.
Following a 40% reduction from Aug 13 to Dec 20, the 20WMA has now started to tick higher and the December high for the weekly RSI (44.9) is also rising. If this RSI is surpassed it becomes the first higher high on the weekly chart since ATHs, ending the weekly bear trend.
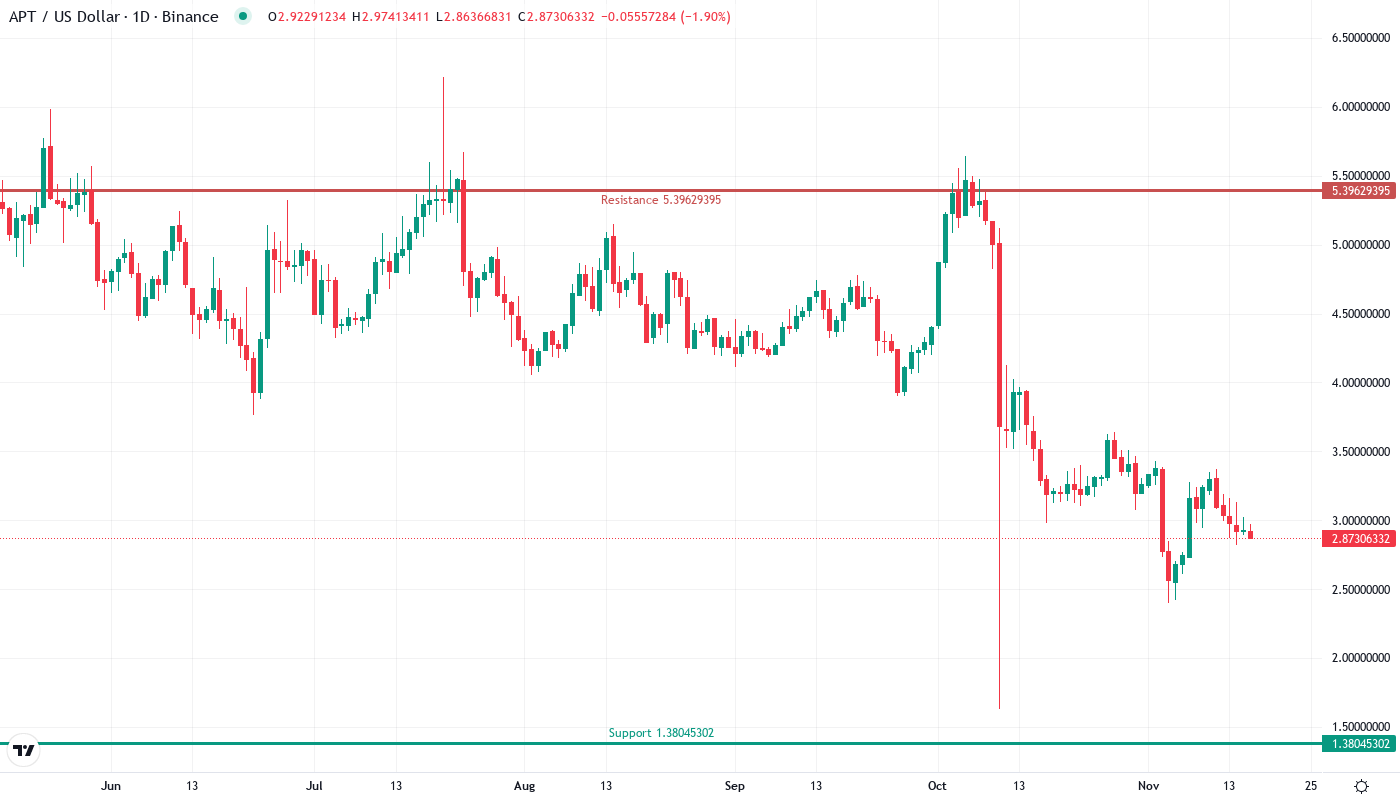
This week’s move is encouraging. It retraced over 70% of the previous week’s losses and APT is set to close with a classic bullish outside week (on the weekly chart, a higher high than the prior week, and a lower low, closing above the prior week’s high), signifying strong dip buying and potential short-squeeze activity. This often signals a near-term low has been formed. The growing potential for a sharp rally could attract sideline money and we could well see further sharp appreciation to $3 and the six-month downtrend line (white).
| Metric | Value |
|---|---|
| Asset | APTOS (APT) |
| Current Price | $2.88 |
| Weekly Performance | -6.80% |
| Monthly Performance | -12.77% |
| RSI (Relative Strength Index) | 39.9 |
| ADX (Average Directional Index) | 37.8 |
| MACD (MACD Level) | -0.17 |
| CCI (Commodity Channel Index, 20-period) | -58.31 |
RSI at 39.9 Signals Momentum Reset After Six-Month Grind
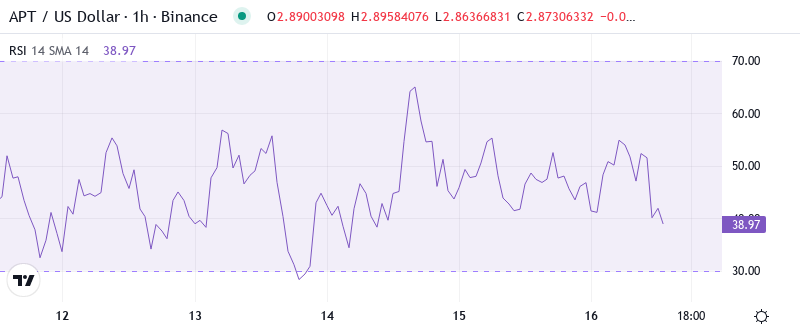
The Relative Strength Index (RSI) indicates a value of 39.94, based on daily timeframes. This indicator has recently left the oversold region below 30, where it stayed during the washout in December. A comparable situation in August preceded a surge of 35%. This means that the oscillator has eliminated sufficient pessimism to enable a new sustainable upswing. The weekly RSI is 37.43 and the monthly RSI is 40.37. The latter indicates that the bears haven’t been entirely exhausted following the 75% decline from annual highs.
Therefore, we can expect and tolerate more than a simple reflexive rally back to resistance. On the downside, the automatic rebound substantially reduces the risk of more drawn-out potential RSI oversold conditions down the road; sellers should be less aggressive above 10k considering the strong hands that just stepped in low.
ADX at 37.8 Confirms Shift From Compression to Trending State
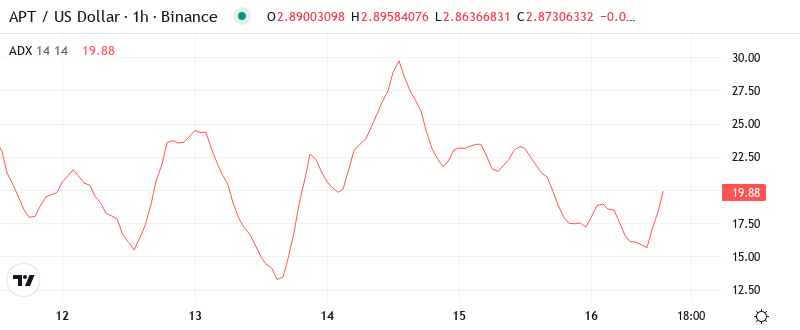
When factoring in trend strength, the ADX currently reads 37.82. This firm move from the sub-20 chop that dictated price action in November. An ADX above 25 suggests that we move from boundary conditions to a trending state whereby momentum strategies outperform mean reversion. This suggests, with price rallying off the lows, that the bias here should be for continued upside momentum.
In essence, the increase in stablecoin momentum causing Aptos to surpass Ethereum in daily supply heralded the breakout of this consolidation. As the ADX crosses above 30 and nears 40, momentum builds. Thus, this is more than your run-of-the-mill bounce. If you’re a day trader, adjust accordingly and look to play the momentum rather than betting against it, as the trend is likely to continue post-ADX crossover at 35.
20-Day EMA at $3.10 Becomes First Major Test for Recovery
The recent spike in volume is a good sign post-news and a handful of big buyers are defending the overnight lows on this rebound. The lack of a block trade today is also a coin flip update. Often the day after and the stock after a block of buyers throw their hat in the ring, insiders at the company receive a heads up, and head to the market. The block trade on APT yesterday might indicate that there won’t be any follow-up announcements, for now. However, that does not mean it won’t take place in the future.
The important part is the compression between the 10-day and 20-day EMAs – they have pinched within 10 cents of each other and created a make-or-break zone between $3.00 and $3.10. This level rejected bids three times in early December ahead of the final breakdown, so reclaiming it would equate to a major structural level changing. The stablecoin narrative is the fundamental catalyst, but price must show out and close above this EMA cluster to give the reversal thesis legs.
Resistance Stacks Between $3.18 and $3.64 as Bears Defend December Highs
There are numerous barriers that buyers will need to overcome to thwart the current downtrend. A minor hurdle is the 20-day EMA at $3.07, followed by the first major resistance level at $3.18 – which is the monthly pivot-point. If the above resistance zone is convincingly breached then room to $3.50 could be seen before December’s high at $3.64 comes into play.
Bulls have a solid defense set up at multiple support fronts forged in this week’s stablecoin-driven surge. Initial defensive posture lines up at $2.85 – where the 10-day EMA and this week’s broken resistance intersect. $2.52 is the key support point, being the weekly pivot and 38.2% Fibonacci retracement of the swing low-ledge-high move. $2.40 is the psychological level that will invalidate the recovery story this month.
The rally is likely to face some resistance near the cluster but if buyers can generate enough demand to lift Aptos above $3.25, the altcoin could rally to $5.00. If the price turns down from $3.25, the APT/USD pair may consolidate for a few days before making the next trending move. The bullish view will be invalidated if the price turns down and breaks below the 20-day EMA ($2.38).
Bulls Target $3.25 Breakout as Stablecoin Momentum Builds
If the price reclaims the 20-day EMA at $3.10, bulls are likely to challenge the $3.25 weekly R1. A daily close above this level will indicate a trend change and could result in a rally to $3.64. The stablecoin sector’s continued growth will likely act as a strong tailwind and prevent sharp declines as it increases the demand for LINK.
If APT were to break $2.52, we could expect to see the recent prices over $2.65 revisited pretty fast, probably on the same day. However, it is highly unlikely that APT will test $2.65 and beyond in any sustainable matter in the upcoming weeks and months. So based on that assumption, I would expect the $2.65 area to cap any rallies from here, with the price reversing back down to retest and potentially breach the support.
Based on the technical setup and underlying tailwinds of flipping Ethereum on stablecoin volume, the most likely short-term outlook is consolidating between $2.85-$3.10 and gearing up to take a shot at $3.25 resistance. The oversold RSI rebound combined with a trending ADX and network adoption statistics put the price action in a mode where the dips are more likely to be bought up than sold into new lows.