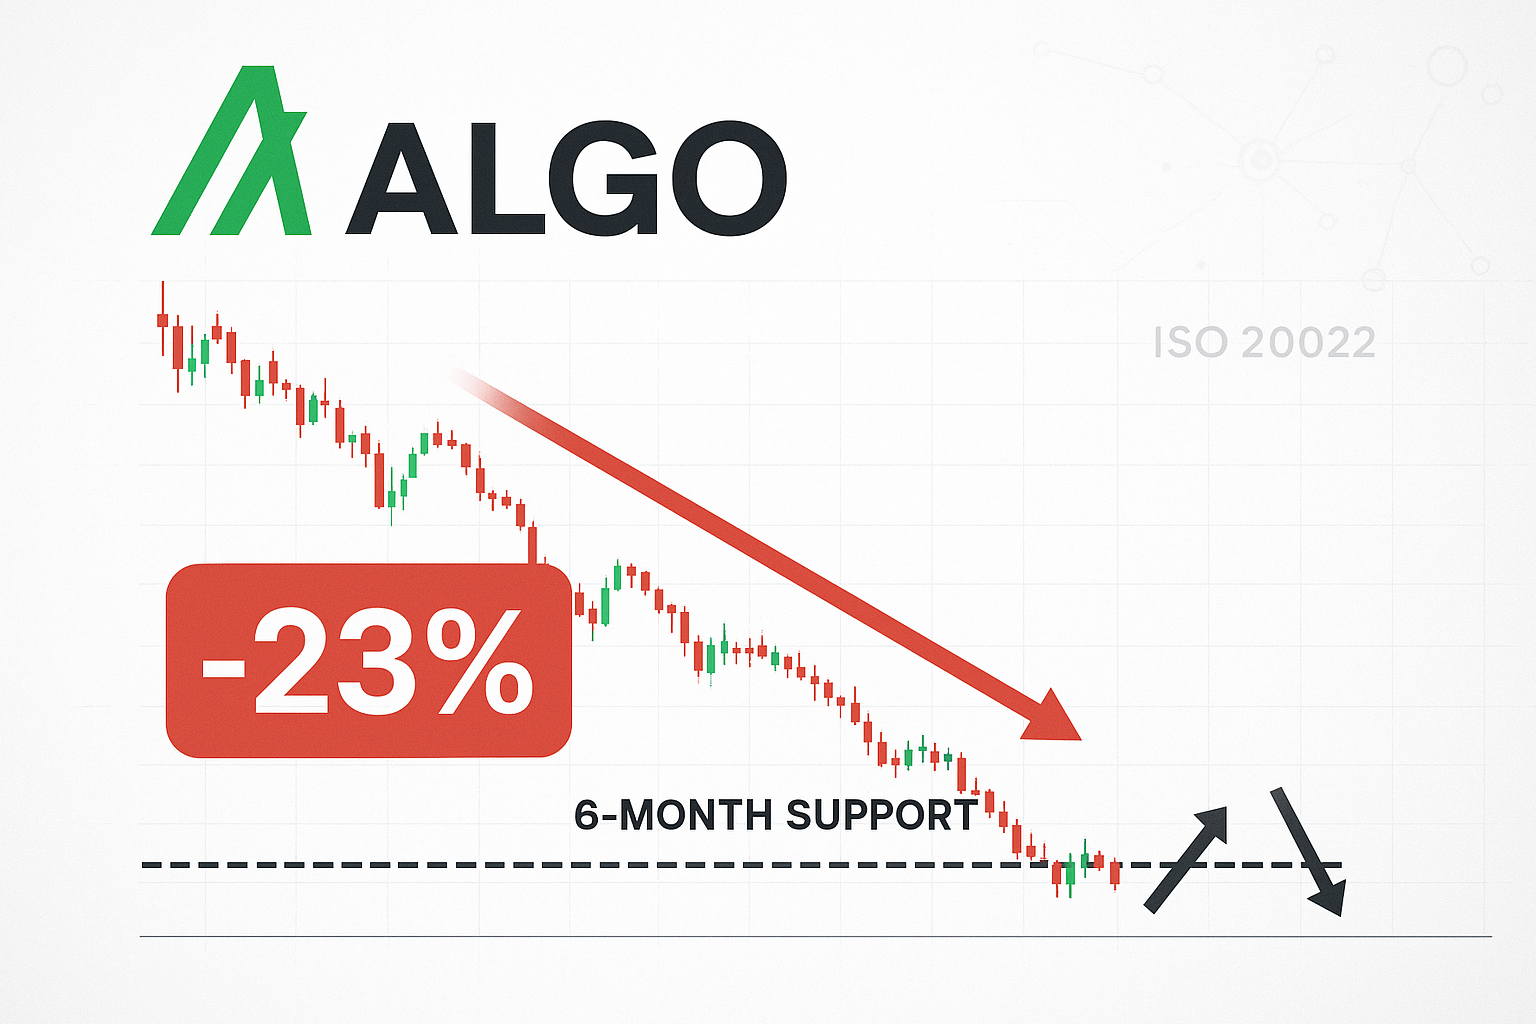
Algorand Tests Six-Month Support After 23% Monthly Plunge as ISO 20022 Adoption Looms
Market Pulse
- ALGO trades at $0.143, down 23.4% over the past month despite self-custody innovation breakthroughs
- Six-time tested support at $0.132 emerges as critical line while ISO 20022 compliance opens institutional doors
- Technical indicators flash oversold extremes matching August’s capitulation phase before 40% relief bounce
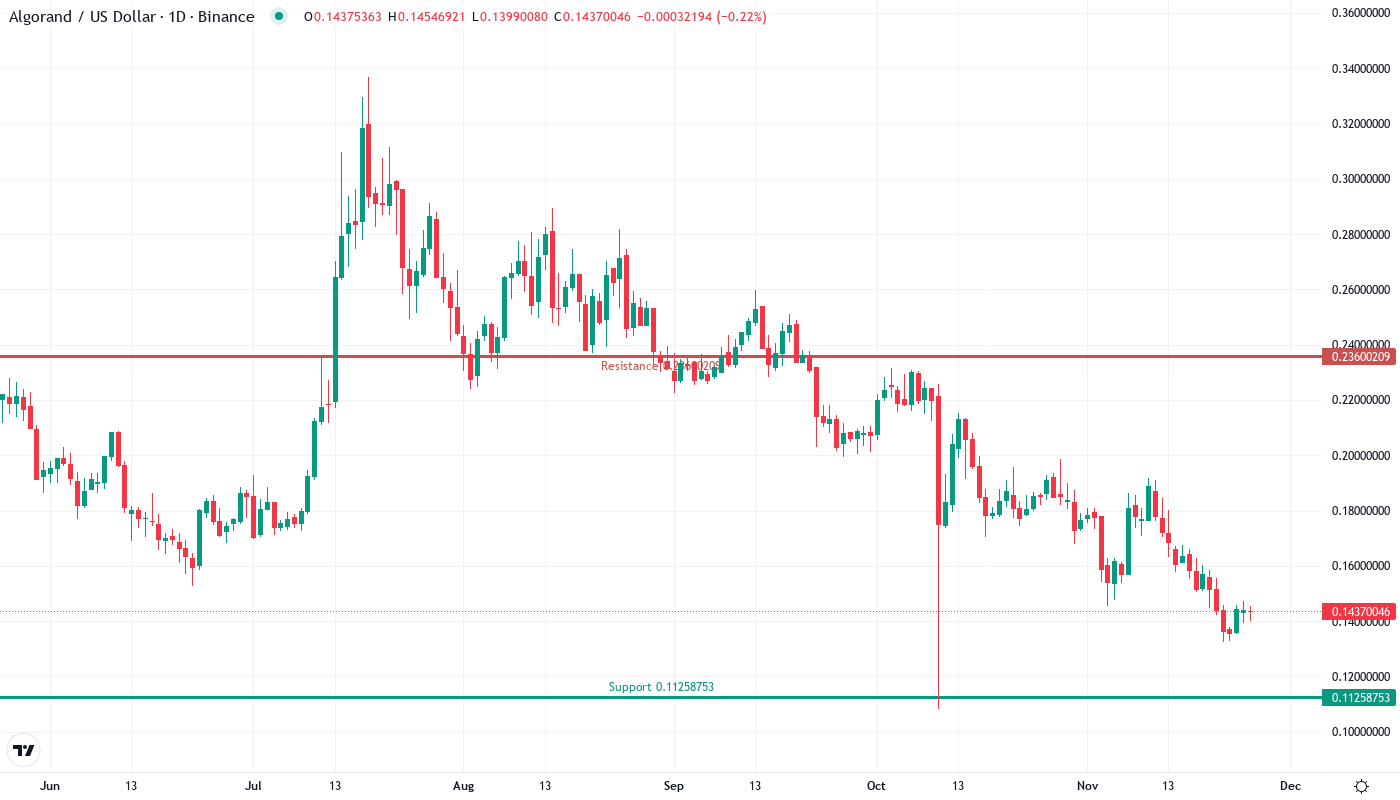
Algorand’s price action tells a story of relentless selling pressure meeting stubborn support, with ALGO shedding 23.4% over the past month to trade at $0.143. The devastating drop from November’s $0.199 peak has erased nearly $0.06 in value, pushing the altcoin into oversold territory not seen since August’s washout. Despite groundbreaking developments in self-custody technology and the approaching ISO 20022 financial messaging standard adoption deadline, sellers have maintained control. The main question for traders is: will the six-time tested support at $0.132 hold once more, or are we witnessing the setup for a deeper flush?
| Metric | Value |
|---|---|
| Asset | ALGORAND (ALGO) |
| Current Price | $0.14 |
| Weekly Performance | -6.15% |
| Monthly Performance | -23.43% |
| RSI (Relative Strength Index) | 37.5 |
| ADX (Average Directional Index) | 30.6 |
| MACD (MACD Level) | -0.01 |
| CCI (Commodity Channel Index, 20-period) | -88.03 |
Momentum Exhaustion Hits 37.5 – Matches August’s Pre-Rally Bottom
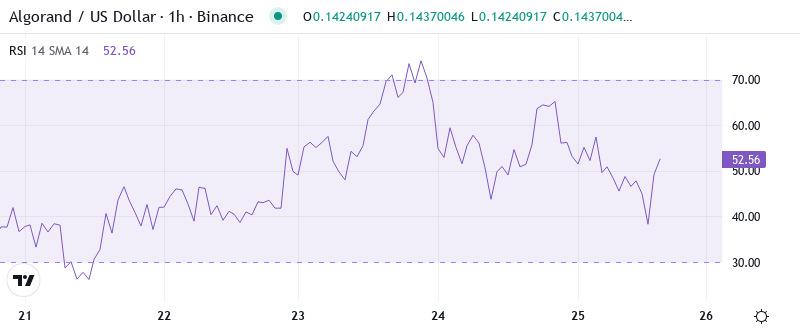
RSI sits at 37.5 on the daily timeframe, marking the first genuinely oversold reading since August’s capitulation phase that bottomed at similar levels. What’s revealing is how quickly momentum collapsed from November’s neutral 50 zone to current distressed levels – a three-week plunge that mirrors the velocity of previous major corrections. The weekly RSI paints an even grimmer picture at 35.4, confirming this isn’t just a brief dip but sustained selling pressure across multiple timeframes.
Similar RSI configurations in August preceded a violent 40% relief rally once the oscillator found its floor near 35. The difference this time stems from the fundamental backdrop – while August’s oversold bounce came amid general market recovery, December’s plunge occurs despite Algorand’s launch of the world’s first self-custody passkey manager and passwordless login features through Pera Wallet. So for swing traders, this disconnect between improving fundamentals and deteriorating technicals creates a potential spring-loading effect where any positive catalyst could trigger an explosive mean reversion.
ADX at 30.6 Confirms Mature Downtrend Nearing Exhaustion Point
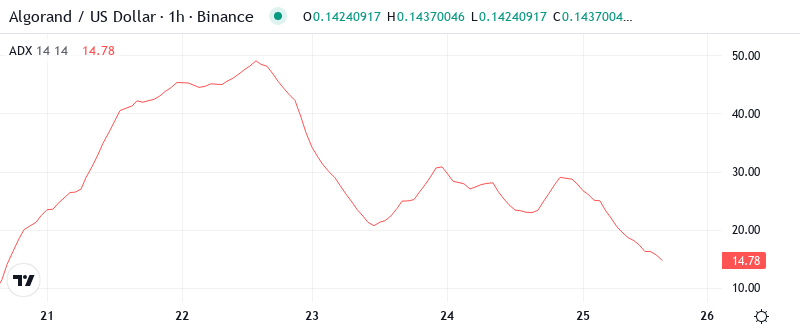
Looking at trend strength, the ADX reading of 30.6 signals we’re deep into a mature downtrend that’s approaching historical reversal zones. Basically, when ADX climbs above 30 during a selloff, it indicates seller conviction has reached extremes that typically exhaust themselves within days rather than weeks. The monthly ADX at an even more extreme 44.5 shows this isn’t garden-variety profit-taking but rather a full-blown liquidation event.
To clarify, these ADX levels suggest we’re transitioning from trending to potential reversal conditions. The last three times daily ADX exceeded 30 during ALGO downtrends, price found significant bottoms within 5-7 trading days. Therefore, contrarian traders should prepare for a potential trend exhaustion setup, especially with the 13-day countdown to global ISO 20022 adoption potentially providing the narrative shift needed to reverse sentiment.
20-Day EMA at $0.156 Becomes First Resistance Target for Any Recovery
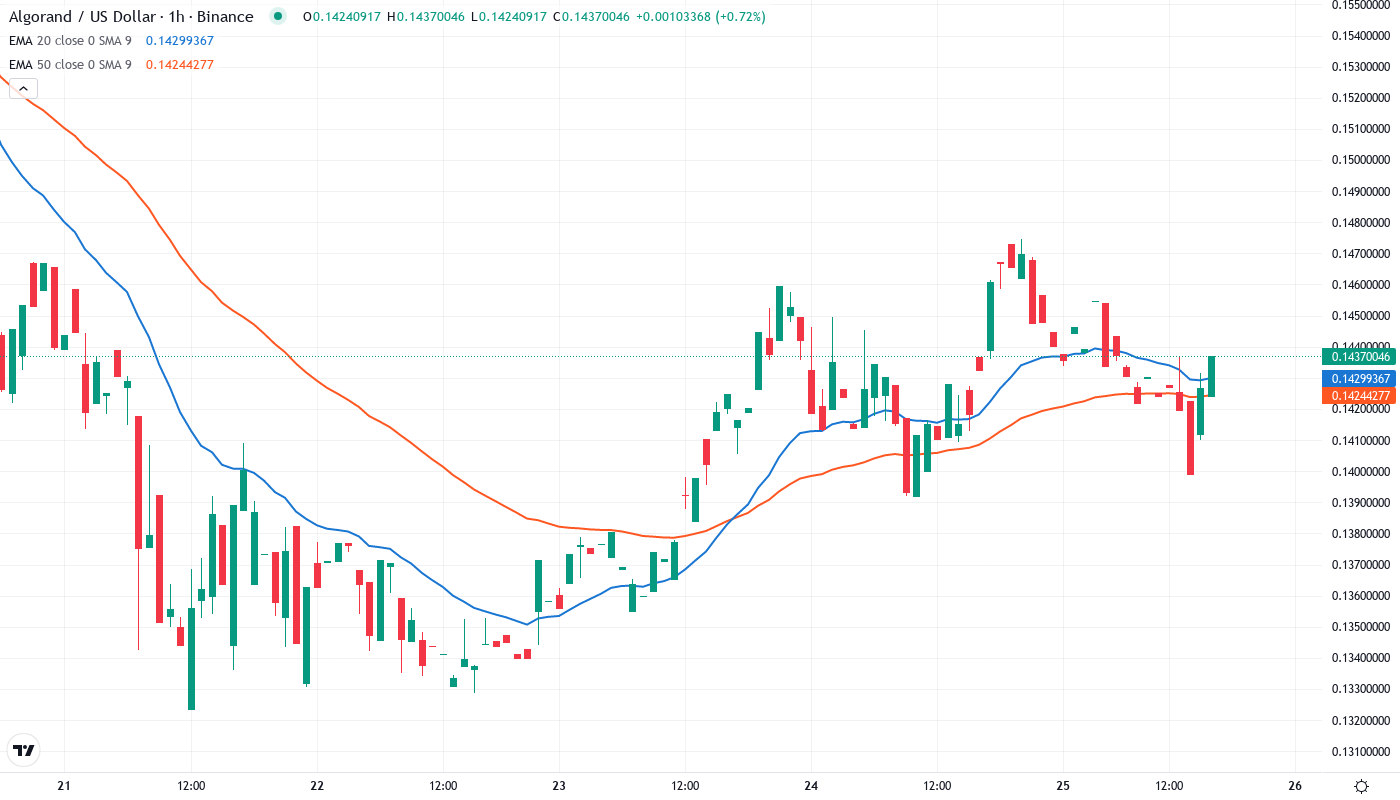
Price action through the EMA ribbons reveals complete bearish control, with ALGO trading below every significant moving average. The immediate overhead resistance starts at the 10-day EMA ($0.148), but more importantly, the 20-day EMA at $0.156 represents the first real test for any recovery attempt. This level rejected advances twice in early December before the breakdown accelerated, making it a proven seller defense zone.
What’s particularly bearish is the compression between the 50-day EMA at $0.174 and the 100-day EMA at $0.193 – when these intermediate averages converge while price trades far below, it often signals an extended period of distribution. The 200-day EMA sits distant at $0.209, roughly 46% above current levels, highlighting just how oversold conditions have become.
For ALGO to shift from bearish to neutral structure, bulls need to first reclaim and hold the 20-day EMA as support, then target the 50-day as the next major hurdle.
Support at $0.132 Tested Six Times Since June – Bulls’ Final Stand
The immediate support zone from $0.132 to $0.135 has transformed into the market’s most critical level, having been tested six times since June without breaking. Each bounce from this area has been progressively weaker, suggesting buyer exhaustion, yet the level continues to hold. December’s low at $0.132 precisely matched June’s bottom, creating a potential double-bottom pattern if bulls can defend it one more time.
Above current price, sellers have stacked resistance between $0.155 and $0.162, where the 20-day EMA converges with November’s breakdown point. The psychological $0.20 level looms as major resistance, having capped every rally attempt since May. This level also aligns with the monthly pivot point, creating a confluence of technical and psychological barriers.
Crucially, the market structure reveals an interesting divergence – while price makes new six-month lows, the volume profile shows accumulation patterns typically seen at major bottoms. The approaching ISO 20022 compliance deadline could serve as the fundamental catalyst to finally break this six-month downtrend, especially given Algorand’s confirmed inclusion in the new financial messaging standard.
ISO 20022 Catalyst Could Spark Reversal From Oversold Extremes
Bulls require a decisive daily close above $0.156 to neutralize immediate bearish pressure and open the path toward $0.174. With RSI deeply oversold and Algorand’s ISO 20022 compliance potentially unlocking institutional flows, any break above the 20-day EMA could trigger a sharp short-covering rally toward $0.20.
The bearish scenario triggers if $0.132 support finally cracks on volume, which would likely flush positions down to the next major support at $0.105 – representing another 27% downside. Such a breakdown would trap recent bottom-fishers and potentially cascade into tax-loss selling pressure typical of December markets.
Given the technical exhaustion signals and approaching ISO 20022 implementation, the most probable near-term path sees ALGO attempting a relief bounce from oversold conditions toward $0.155-0.162 resistance before the market determines whether this fundamental catalyst carries enough weight to reverse the six-month downtrend.