Algorand Darts Below December Lows as Quantum-Proof Speculation Meets Market Reality
Market Structure Shifts Lower
- ALGO shed 11% this week despite quantum security milestone announcement
- Price action confirms bearish structure with lower highs and lower lows intact
- Support at $0.127 faces sixth test since December – failure targets $0.115
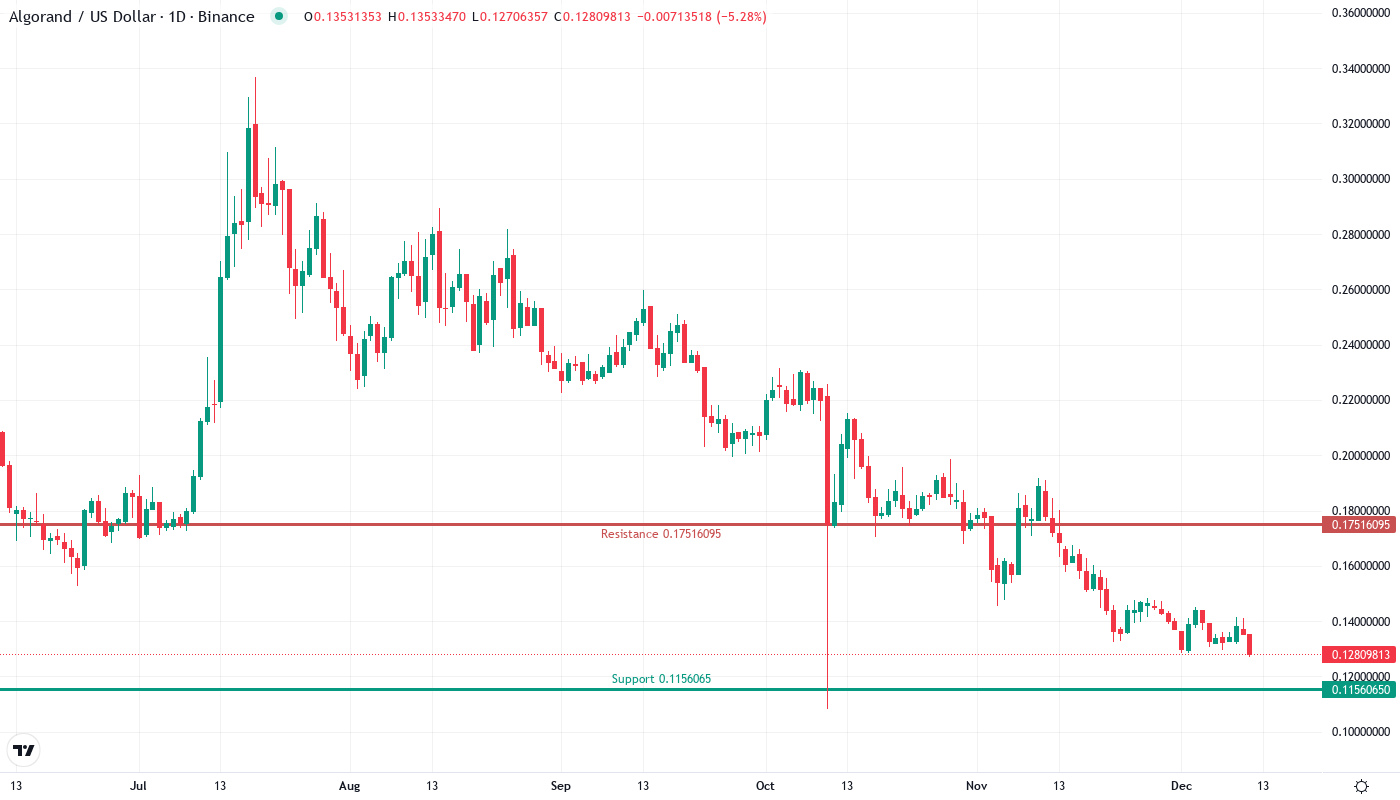
Algorand slid to $0.128 this week, extending a devastating 31% monthly collapse that puts the token dangerously close to testing yearly lows despite launching the blockchain industry’s first live post-quantum transactions. The disconnect between fundamental developments and price action tells a familiar crypto story – innovation alone can’t fight broader market forces when sellers dominate. The main question for traders is: can the much-tested $0.127 support hold through another assault, or will ALGO finally crack toward the psychological $0.10 level?
| Metric | Value |
|---|---|
| Asset | ALGORAND (ALGO) |
| Current Price | $0.13 |
| Weekly Performance | -11.02% |
| Monthly Performance | -31.49% |
| RSI (Relative Strength Index) | 36.8 |
| ADX (Average Directional Index) | 30.5 |
| MACD (MACD Level) | -0.01 |
| CCI (Commodity Channel Index, 20-period) | -132.64 |
Momentum Exhaustion Signals Capitulation Phase Near Completion
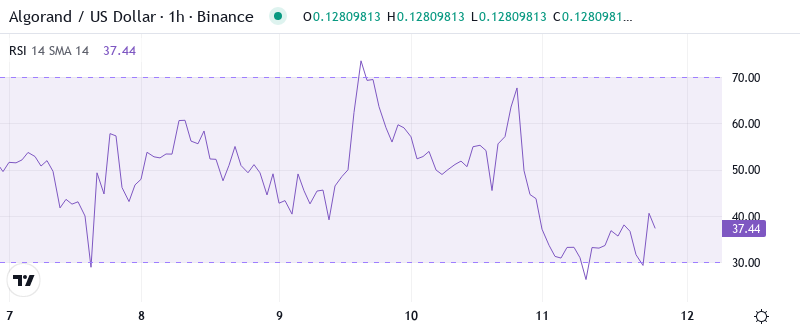
RSI sits at 36.75 on the daily timeframe, marking oversold territory for the first time since the August washout that preceded a 40% relief rally. What’s revealing is how momentum deteriorated steadily rather than crashing – the oscillator dropped from neutral 50 to current levels over three weeks of grinding lower, suggesting systematic distribution rather than panic selling. Similar RSI configurations below 40 in June and August both marked intermediate-term bottoms, though each required multiple days of basing before reversals materialized.
For swing traders hunting reversals, this oversold reading creates opportunity but demands patience. The weekly RSI at 33.07 confirms the daily’s pessimistic stance while the monthly print of 42.10 shows we’re not at extreme washout levels yet. Basically, momentum indicators flash yellow rather than green – conditions favor a bounce but don’t guarantee one immediately, especially with Europe’s Ledger integration news failing to spark any buying interest.
ADX at 30.47 Confirms Mature Downtrend Seeking Exhaustion
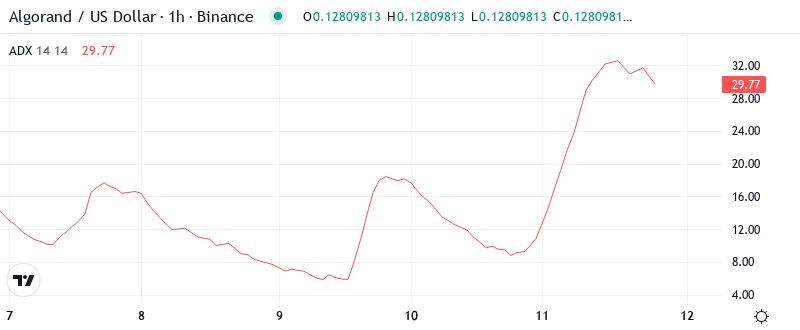
Looking at trend strength, the ADX reading of 30.47 signals we’re dealing with a genuine trending market rather than choppy consolidation – and unfortunately for bulls, that trend points decisively lower. ADX climbed from the low 20s through 25 and now past 30, marking the progression from ranging conditions to directional movement that trend followers love. The concerning part is that ADX typically peaks between 35-40 before trends exhaust, suggesting this selloff might have another leg down before reversing.
To clarify, current ADX levels indicate bears maintain control but approach the zone where profit-taking often emerges. Historical ALGO patterns show ADX readings above 30 coinciding with 25-35% moves from peak to trough – we’re already 31% down from December highs, placing us in the typical reversal window. Therefore, day traders should prepare for increased volatility as the mature trend battles exhaustion, with any ADX rollover below 30 potentially signaling the selling pressure finally abating.
10-Day EMA at $0.135 Becomes First Resistance Target for Recovery
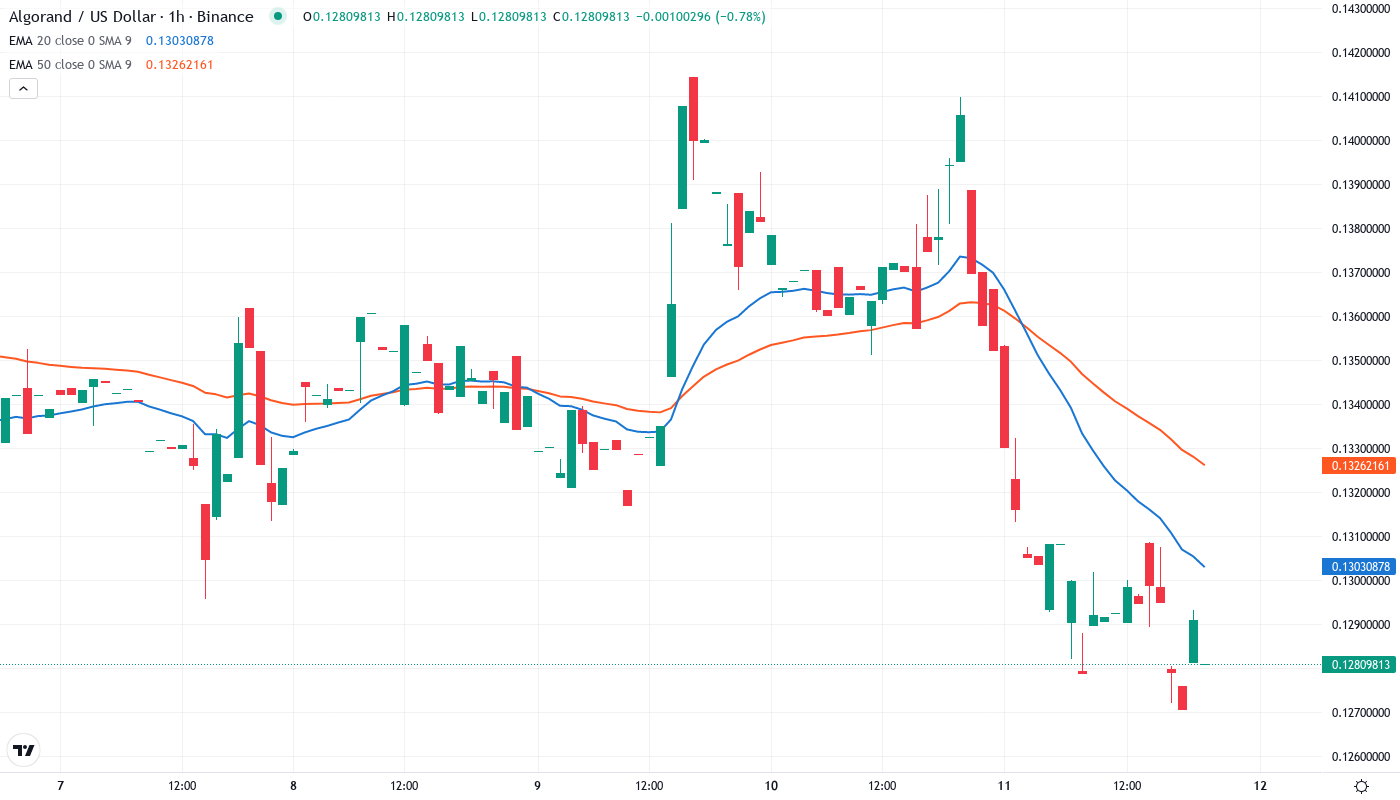
Price action through the EMA ribbons paints a textbook bearish picture. ALGO trades below every major moving average – the 10-day ($0.135), 20-day ($0.140), 50-day ($0.156), and distant 200-day at $0.198. Each attempted bounce since December faced rejection at progressively lower EMAs, with the 20-day particularly effective at capping rallies. The 50-day EMA flipped from support to resistance after ALGO’s quantum-proof blockchain announcement failed to sustain buying above $0.145, trapping late momentum chasers.
Most telling is the compression between the 10-day and 20-day EMAs, now separated by just $0.005 compared to $0.015 in early December. This tightening suggests the immediate selloff velocity is moderating, though bulls need to reclaim at least the 10-day EMA to shift near-term momentum. The psychological $0.15 level aligns closely with the 50-day EMA, creating a formidable resistance cluster that would require significant volume to overcome – likely needing a broader crypto market recovery rather than ALGO-specific catalysts.
Support Architecture Weakens as $0.127 Faces Critical Test
Resistance stacks heavy between the 10-day EMA at $0.135 and the monthly pivot at $0.155, with December’s breakdown level at $0.145 acting as the key battleground. Sellers defended this zone three times in the past two weeks despite positive quantum security headlines, confirming the technical damage inflicted by December’s collapse. The monthly R1 at $0.175 feels distant given current momentum, requiring a 37% surge just to reach what was support in November.
Bulls defend their final stronghold at $0.127, a level that’s provided six bounces since June but shows signs of weakening with each test. Volume on recent bounces decreased progressively – the latest defense attracted 30% less buying than December’s save, suggesting exhaustion among dip buyers. Below this critical support, the chart shows an air pocket to $0.115 (monthly S1) and potentially the psychological $0.10 level that hasn’t traded since the 2023 bear market depths.
Market structure reveals a textbook downtrend with lower highs and lower lows firmly established since November’s $0.22 peak. The pattern resembles a descending triangle with support at $0.127 and resistance declining from $0.185 to $0.165 to current $0.145 – a formation that typically resolves lower unless bulls can engineer a surprise breakout. The integration into Europe’s unified ledger system provides fundamental hope, but technical reality suggests more pain before any sustainable recovery emerges.
Quantum-Proof Rally Requires Volume Surge Above $0.145
Bulls require a decisive daily close above $0.145 with volume exceeding the 20-day average to flip market structure bullish. Such a move would reclaim the breakdown point and potentially trigger short covering toward $0.165, where the 50-week EMA lurks. The quantum security narrative could provide the fundamental catalyst if broader crypto markets stabilize, but ALGO needs to prove demand exists beyond speculative headlines.
The bearish scenario triggers if $0.127 finally cracks on volume, opening a swift move to $0.115 and likely psychological capitulation at $0.10. Loss of six-time tested support would trap the remaining bulls who bought the quantum-proof narrative, potentially creating a final washout low. Watch for any daily close below $0.125 as confirmation the support has failed – from there, catching falling knives becomes especially dangerous.
Given the mature downtrend shown by ADX and oversold momentum readings, the highest probability near-term outcome involves continued consolidation between $0.127-$0.135 as the market digests recent losses. The quantum security developments and European ledger integration provide longer-term fundamental support, but technical damage needs time to repair before any sustainable rally emerges. Risk-conscious traders should wait for either confirmed support at $0.127 or a volume breakout above $0.145 before taking positions.