ALGO Faces Crucial Test at $0.157 as Bulls Guard Six-Month Support
Market Structure Shifts Lower
- ALGO dropped 14.95% over the past month, extending losses from December’s rejection at $0.199
- Six-time tested support at $0.157 holds despite broader market pressure
- Technical indicators reset from oversold extremes, creating room for potential bounce
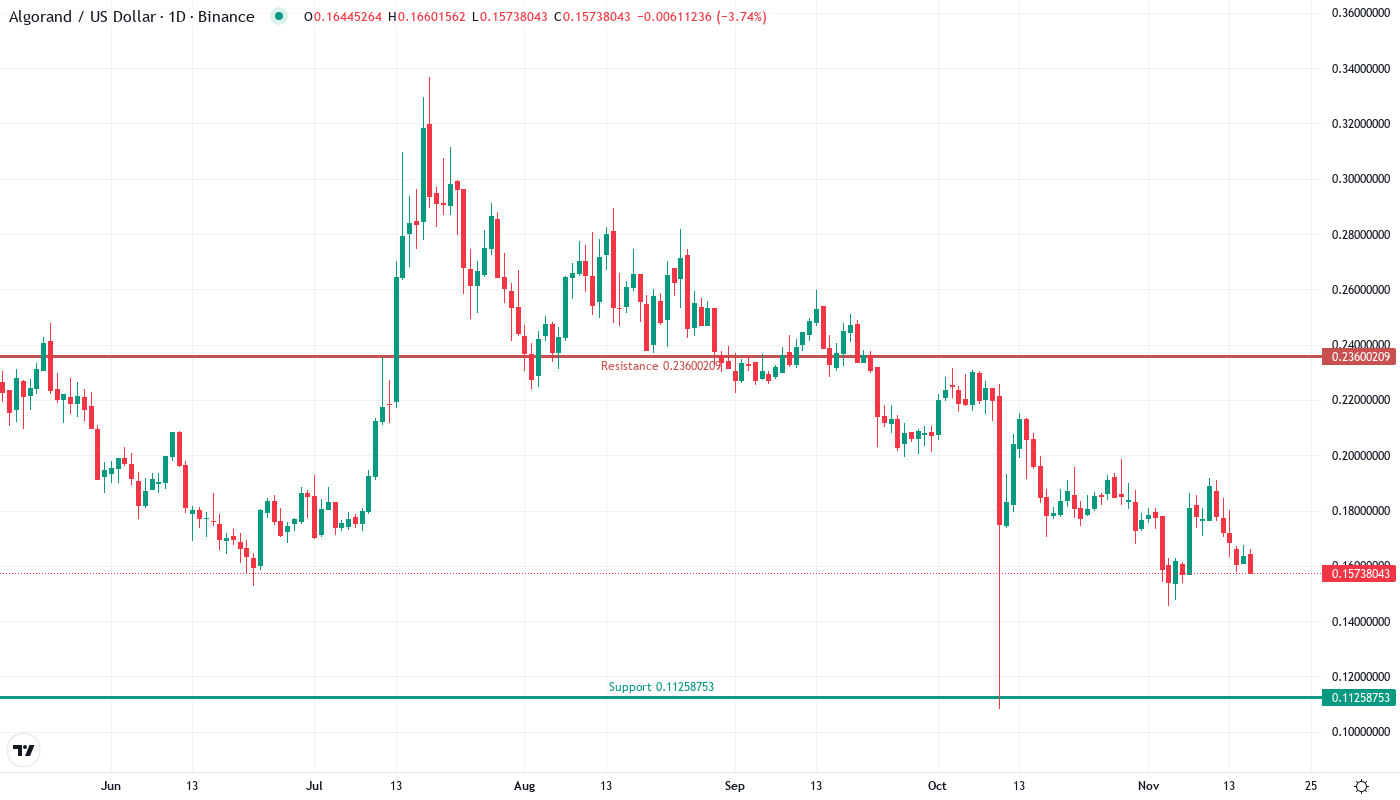
Algorand’s price action tells a story of resilience amid adversity. The token shed 14.95% over the past month and sits down 10.86% on the weekly timeframe, yet bulls have managed to defend the critical $0.157 support level that has held firm since June. This level has now been tested six times, with each bounce growing slightly weaker – a pattern that typically precedes either a decisive breakdown or a powerful spring higher. The main question for traders is: will the recent security innovations and ISO 20022 adoption provide enough fundamental strength to finally break the downtrend?
| Metric | Value |
|---|---|
| Asset | ALGORAND (ALGO) |
| Current Price | $0.16 |
| Weekly Performance | -10.86% |
| Monthly Performance | -14.95% |
| RSI (Relative Strength Index) | 39.2 |
| ADX (Average Directional Index) | 25.7 |
| MACD (MACD Level) | -0.01 |
| CCI (Commodity Channel Index, 20-period) | -90.43 |
RSI at 39.20 Signals First Oversold Touch Since August Bottom
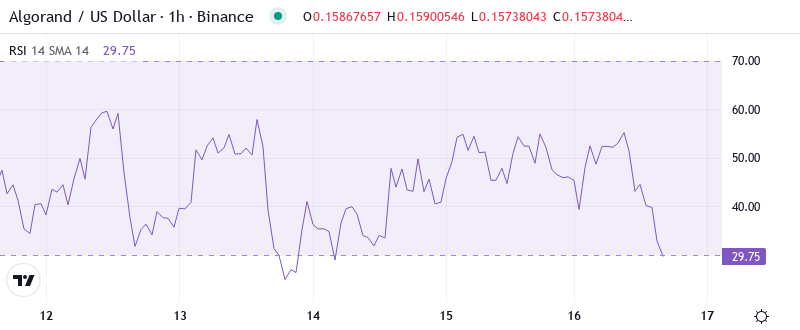
Reading the oscillator at 39.20, traders see the first genuine oversold condition in four months. The last time daily RSI dropped this low, ALGO bounced 35% within two weeks. What’s particularly interesting is how the RSI has reset from the overbought extremes near 70 that marked December’s local top at $0.199, creating significant room for upside momentum to rebuild.
So for swing traders, this oversold RSI combined with the six-time tested support creates a compelling risk-reward setup. The passwordless login innovation and self-custody passkey manager launch provide fundamental catalysts that weren’t present during previous tests of this level. It is worth mentioning that similar RSI configurations in September and November both preceded double-digit percentage rallies within 10-14 days.
ADX Drops to 25.74 as Selling Pressure Exhausts
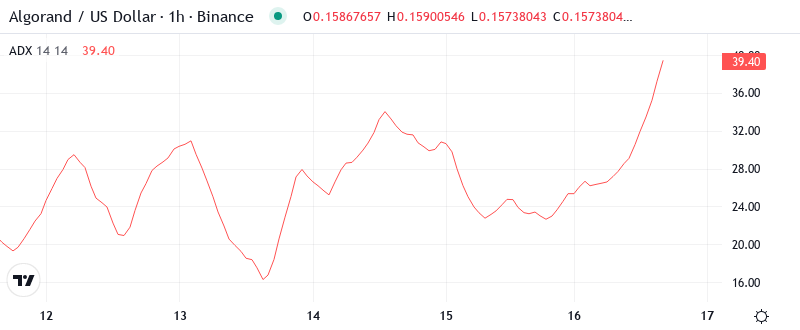
Trend strength indicators reveal an important shift developing. ADX currently reads 25.74, dropping from above 30 just days ago – signaling that the aggressive selling pressure from December’s highs is losing steam. Basically, the market is transitioning from a strong downtrend into a more balanced state where buyers can potentially regain control.
Looking at the broader picture, this ADX configuration matches what occurred before ALGO’s October rally. The -DI dominance is weakening while +DI begins to curl higher, suggesting bears are running out of ammunition at these levels. Therefore, momentum traders should prepare for increased volatility as the tug-of-war between bulls and bears intensifies near this critical support zone.
20-Day EMA at $0.173 Becomes First Resistance Target
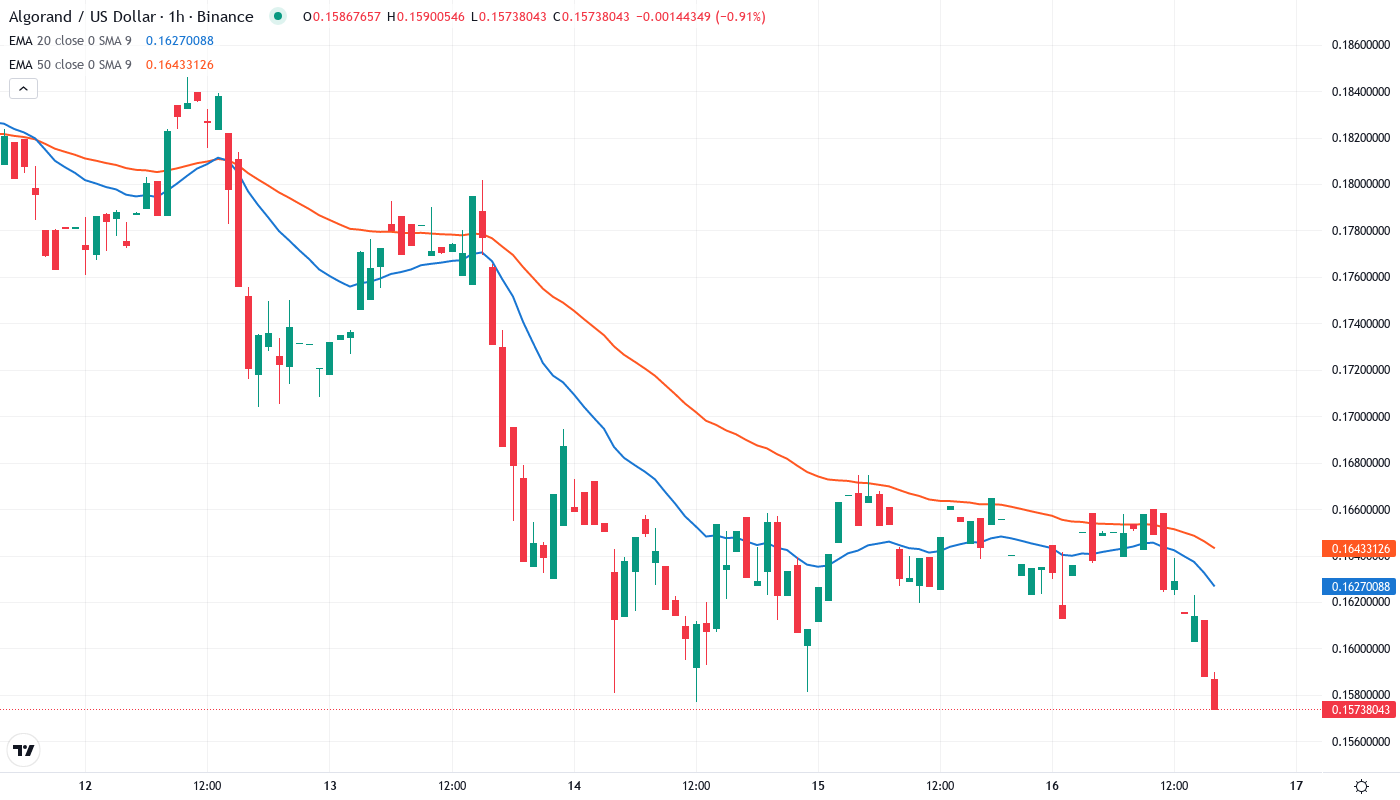
Price trades below the entire EMA ribbon, with the 10-day EMA at $0.168 acting as immediate overhead resistance. More significant is the 20-day EMA at $0.173, which has capped every rally attempt since the December breakdown. The 50-day EMA sits much higher at $0.187, marking the line bulls need to reclaim to shift the intermediate trend.
What stands out here is the compression between the 10 and 20-day EMAs. This tight clustering often precedes explosive moves as trapped traders on the wrong side are forced to cover. The 100-day EMA at $0.203 and 200-day EMA at $0.215 remain distant targets, but reclaiming the 20-day would signal the first phase of a potential trend reversal.
Support at $0.157 Tested Six Times – Bulls Make Final Stand
Resistance stacks heavy between the 10-day EMA at $0.168 and December’s breakdown point at $0.185. The monthly pivot at $0.172 adds another layer of selling pressure. Above that, the psychological $0.20 level that rejected December’s rally looms large, coinciding with the 100-day EMA.
Bulls defend multiple support layers below current price. The immediate support at $0.157 has proven remarkably durable through six separate tests since June. Below that, the next major support doesn’t appear until $0.135, representing a 14% drop from current levels. The June lows at $0.112 mark the final defense before returning to bear market lows.
This configuration resembles a coiled spring. Each test of $0.157 has seen declining volume, suggesting sellers are exhausting their supply at these levels. The global banks’ race to adopt ISO 20022 and Algorand’s strategic positioning in this standard could provide the fundamental catalyst needed to finally break the multi-month downtrend.
Bulls Need Volume Surge Above $0.173 to Confirm Reversal
Bulls require a decisive close above the 20-day EMA at $0.173 with expanding volume. Such a move would flip the first resistance to support and open a measured move toward $0.187. The self-custody innovations and growing institutional adoption via ISO 20022 compliance provide the narrative support for a sustained rally if technical levels align.
The bearish scenario triggers if $0.157 finally cracks on volume after six successful defenses. This would trap recent buyers who bet on another bounce, likely cascading stops down to $0.135. A weekly close below $0.157 would paint the most bearish picture, potentially accelerating losses toward the psychological $0.10 level.
Given the oversold RSI, exhausted selling pressure shown by declining ADX, and fundamental catalysts building, the most probable near-term path sees ALGO consolidate between $0.157-$0.173 before attempting another assault on the 50-day EMA. The convergence of technical oversold conditions with positive fundamental developments suggests patient accumulation rather than panic selling at these levels.

