AAVE Tests Crucial Support as MiCA Approval Sparks Euro Stablecoin Integration
Market Structure Moves Higher
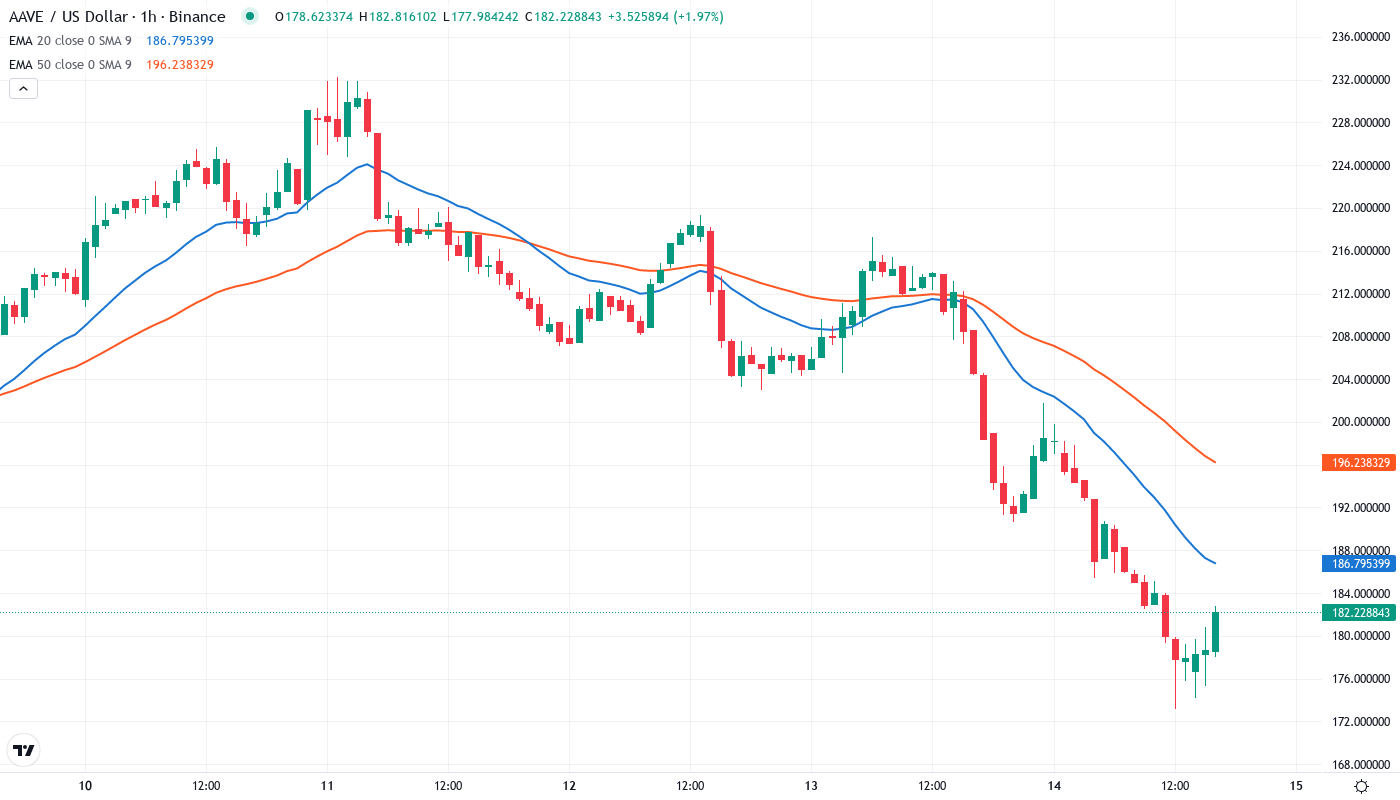
- AAVE is currently trading at $181.38 after losing 7.97% over the past seven days.
- The token is holding key support levels around the psychological $180 mark.
- Europe’s approval for a fully regulated euro stablecoin provides fundamental bullish catalysts.
AAVE is currently trading sideways near $181 after receiving the European Commission’s first market in crypto-assets approval for fully regulated euro stablecoin activities and custodial wallet holdings. Transactions of the USD coin (USDC) regulated and landli…
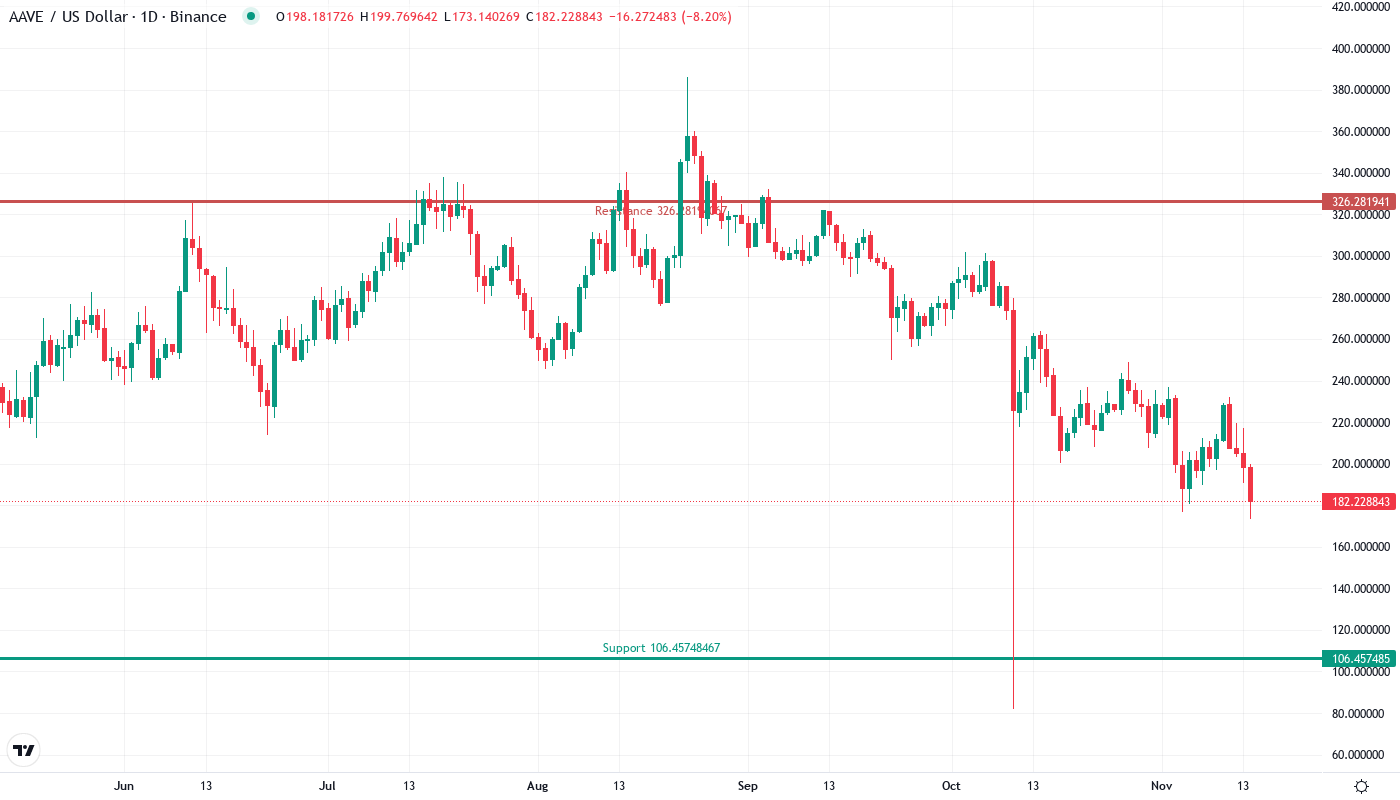
AAVE is currently trading at $181.38, as it lost 7.97% over the previous seven days. However, the token is holding some important support levels. Europe’s massive regulatory approval of the protocol metaverse stablecoin arrived as the price was testing the psychological $180 level, which seems to be an ideal storm of technical and fundamental factors lining up. The question for traders is whether this announcement provides enough momentum to swing the asset out of a month’s accumulation between $155 and $211.
| Metric | Value |
|---|---|
| Asset | AAVE (AAVE) |
| Current Price | $181.38 |
| Weekly Performance | -7.97% |
| Monthly Performance | -28.96% |
| RSI (Relative Strength Index) | 37.3 |
| ADX (Average Directional Index) | 36.3 |
| MACD (MACD Level) | -11.09 |
| CCI (Commodity Channel Index, 20-period) | -146.64 |
Momentum Holds Mid-Range After December’s Volatility
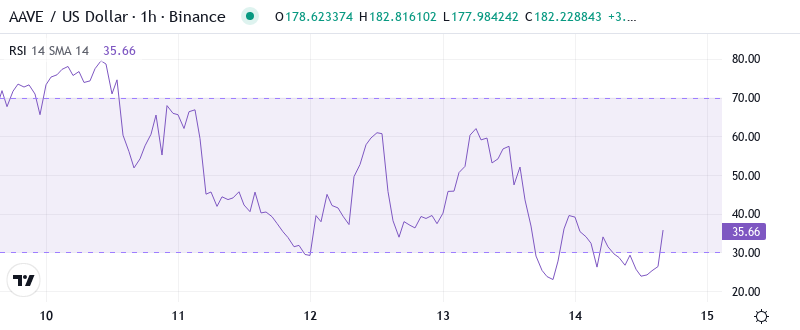
The RSI reads 48.70 on the daily timeframe to place the oscillator in entirely neutral waters after vacillating between technically oversold reads at 31.86 last month and technically overbought reads near 58. This equilibrium reading implies the bulls nor the bears clearly have an advantage in the very near term, however, the recovery from December’s sub-32 print is identical to the setup ahead of November’s blast higher to $248. The EU stablecoin approval could not have arrived a better time from a technical standpoint, with momentum oscillators across the board cooled off and issuing early buy signals.
What is interesting to note is the behavior of RSI during the most recent 28.95% monthly decline – never reaching extreme oversold conditions below 30, showing that sellers never had much conviction even as price dropped almost $70 from December highs. Therefore, with swing traders, this resilient RSI structure along with the GHO launch catalyst would imply accumulation and not distribution, especially as institutional players look to the newly compliant euro-to-stablecoin rails.
ADX at 36.28 Signals Trend Strength Despite Recent Chop
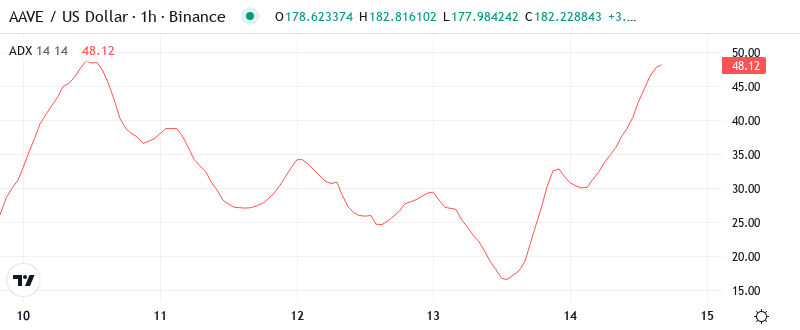
Based on trend strength, the ADX reading of 36.28 shows that we’re moving from the recent consolidation phase to trending phase. Essentially, when ADX rises above 25, it indicates that the ranging price action is coming to an end, and at current levels above 36, the indicator shows that real directional movement is forming. Thats happening just in time for AAVE’s regulatory event – technical trends often form as a result of the fundamental ignition.
In simple terms, the ADX is telling us that in spite of minor weakness on the weekly chart, overall the main trend lower remains unchanged at the moment in time. The +DI and -DI spread shows that bears have a slight edge at the time of this reading, but the trend strength figure warns of volatility having a strong presence. Hence, short-term strategies must give way to trend-following models as the MiCA-inspired Eurorally begins to gather steam.
20-Day EMA at $211 Caps Rally Attempts While 200-Day Provides Floor
Looking ahead to January 2022, price trades comfortably above the 2022 VWAP (yellow line) and monthly VWAP (white line) with hopes the latter can guide higher, before the transition to the next month’s value area. A new week’s truncated trading will likely create some market chop for alts for the first session or two. Price needs to maintain above $200.00 to keep optimistic buying volumes.
The bulls are facing some stiff resistance, with the 20-day EMA at $211 and just above that, the downtrend line from the all-time highs. If the price turns down from either resistance, the bears will once again try to sink the price below the 200-day EMA. If they succeed, the AAVE/USD pair could drop to $150 and then to $104. Such a move will indicate that the advantage has tilted in favor of the bears.
Resistance Clusters Between $204-$234 While Support Builds at $155
There’s a potential window to make a push for the 50-week and 21-month EMAs in the $237-$253 region. Beyond that, a close over October’s high of $255 would be the first higher high since the May drawdown and signal the start of a more sustainable local uptrend after the relief rally from December’s low. Should the broader trend continue improving, the summer’s three-week retracement in the $259-$283 zone will likely become the next phase to conquer.
The support architecture appears more solid following the successful $155.00 tests, where the 200-day EMA meets the monthly S1 pivot at $141.81. This confluence has stood up to several assaults, and each rebound draws more buyers who see regulatory news as a potential watershed for AAVE’s expansion in Europe. Intermediate support is also available around $173, where December’s low and the monthly S2 pivot zone spread.
Bulls protect these support levels more firmly as the protocol’s compliant stablecoin architecture becomes operational throughout the European market. The capacity to provide zero-fee euro-to-GHO turns with complete regulatory backing presents a competitive ditch that didn’t work during the downturn in December. This inherent benefit is likely to result in institutional flows at these bottomed rates, supporting the reinforced level.
Bulls Need Decisive Close Above $211 to Confirm MiCA-Driven Recovery
For now though, the bear camp holds the edge until further notice. Perhaps this churn sets in for a few more weeks and makes for an inverted right shoulder. Time will tell, and preservation of trading capital through this discovery process remains paramount.
If the bullish thesis plays out, new resistance will sit at the monthly value area of $199.5, with stronger resistance at the prior weekly range high of $211.5. Above this level and a continued short-covering rally could reach $250.
With the neutral momentum readings, the established support at $155, and the entry of compliant euro stablecoin onto the scene, the most likely short-term trajectory has AAVE ranging between $173-$211 as the market absorbs the MiCA news. Subsequently, as institutional participants become aware of the edge given by regulated GHO ramps, the chances of breaking $211 grow.