Cardano Plunges 15% as Momentum Exhausts Despite Stablecoin Push
Market Pulse
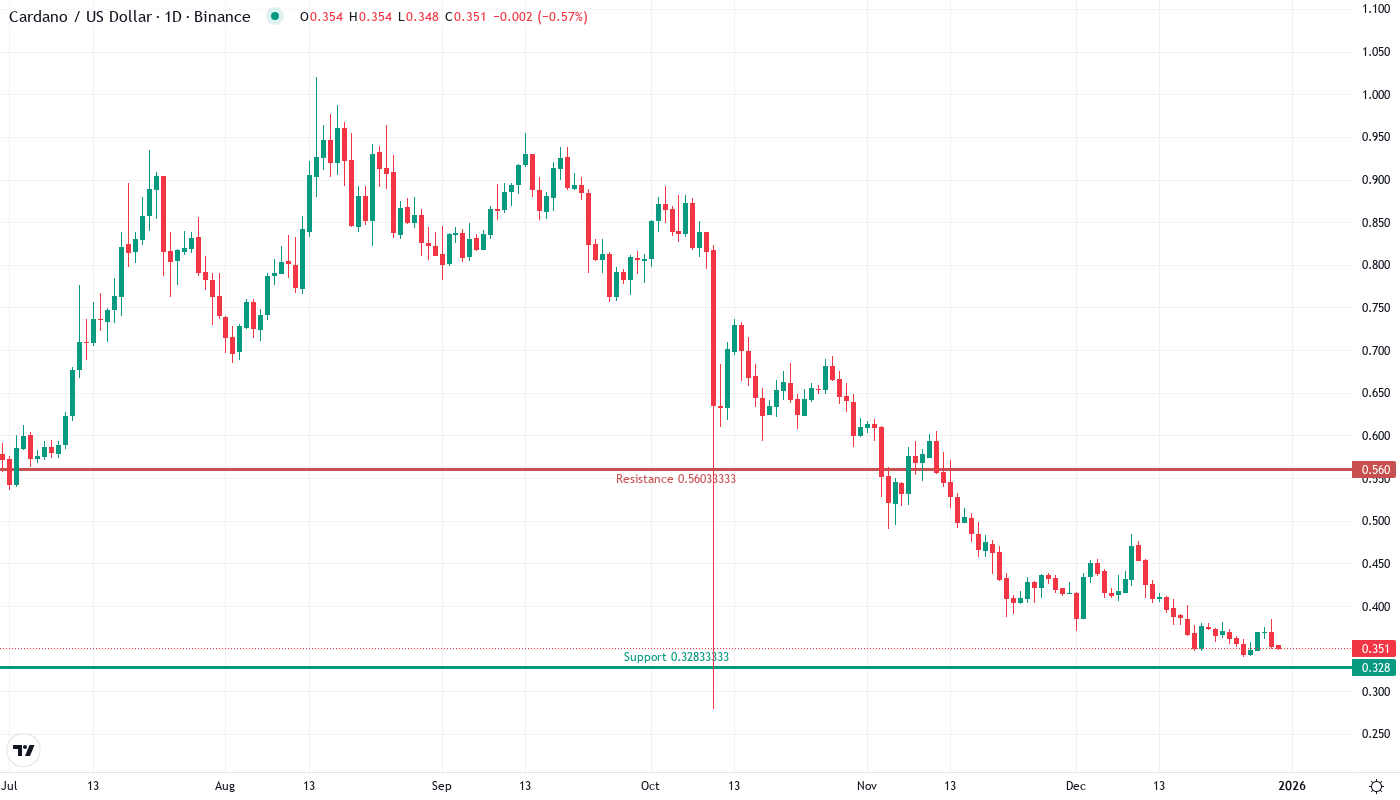
- Cardano (ADA) had a sharp correction to $0.35 from $0.48 after failing to hold the psychological $0.40 level as support.
- Although the oversold conditions were in place last week, the sharp retail capitulation over the weekend seems poised to test the downside again.
- The 12-hour chart shows that the relative strength index was at 40 when the news was announced and hit a high of 44 before cooling off and giving way to the extreme bearish momentum as the RSI dropped to 31.5, entering oversold territory for the first time since the May capitulation.
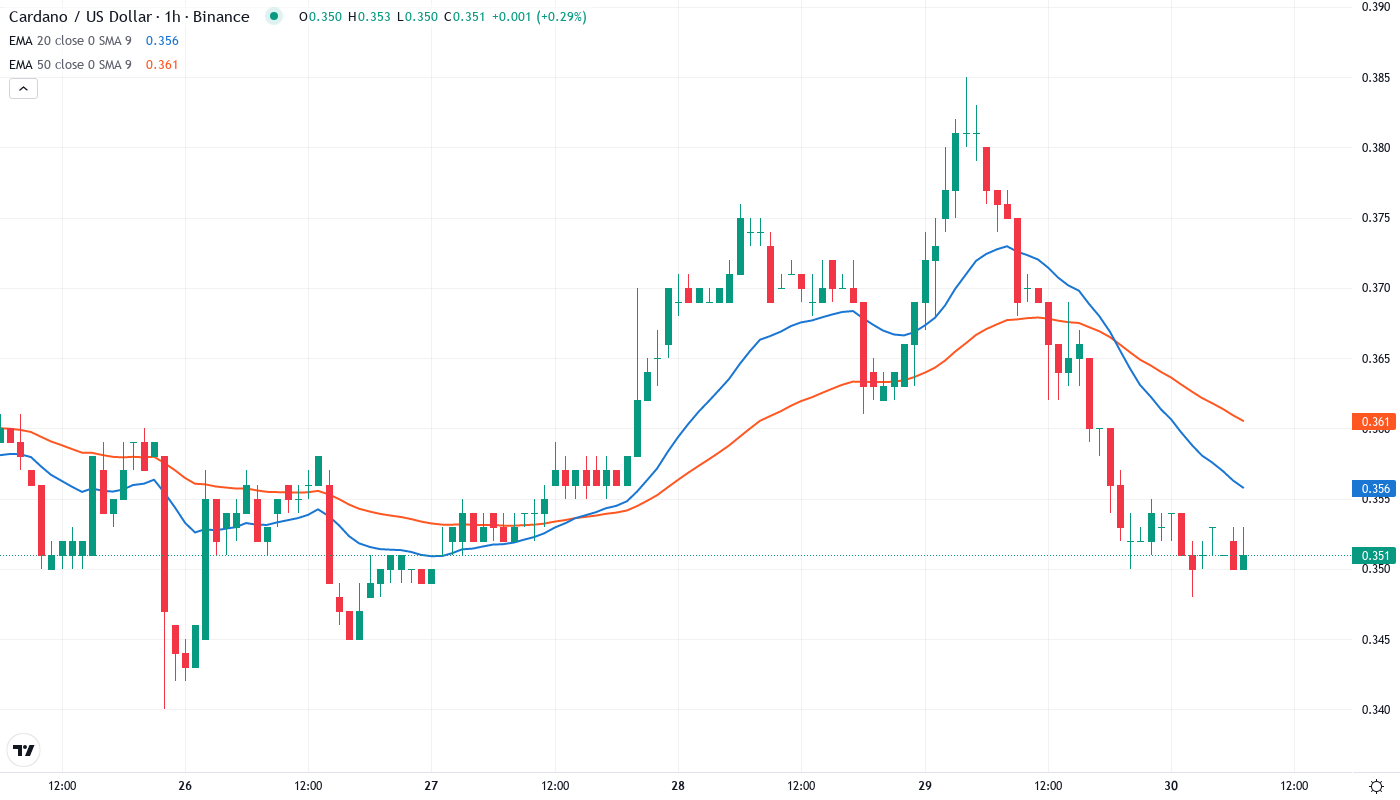
Cardano’s performance has been very disappointing for the past month. It has lost 15.4% of its value in a month. Currently, ADA is being traded at $0.351, having lost the psychologically important level of $0.40 which was defended by the bulls in December. While Charles Hoskinson has been making efforts for stablecoin integration, and there are talks of Bitcoin DeFi connectivity, the technicals are showing a picture of exhausted momentum and weak support levels that have trapped the late buyers. The main question for the traders is: will the oversold bounce come near these levels, or we would see a further slide towards the key support of $0.33?
| Metric | Value |
|---|---|
| Asset | CARDANO (ADA) |
| Current Price | $0.35 |
| Weekly Performance | -5.14% |
| Monthly Performance | -15.42% |
| RSI (Relative Strength Index) | 37.9 |
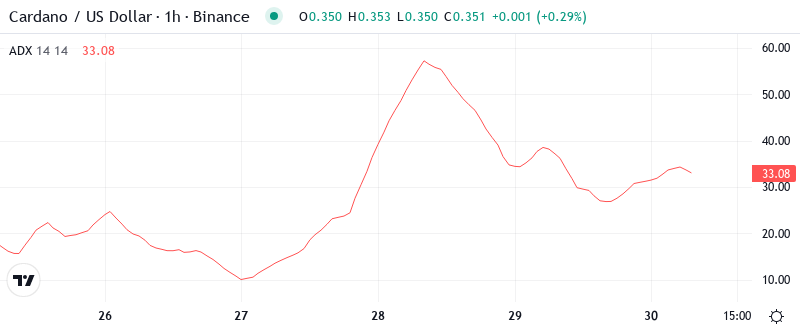
| ADX (Average Directional Index) | 37.0 |
| MACD (MACD Level) | -0.02 |
| CCI (Commodity Channel Index, 20-period) | -91.72 |
RSI Drops to 31.5 – First Oversold Reading Since August Washout
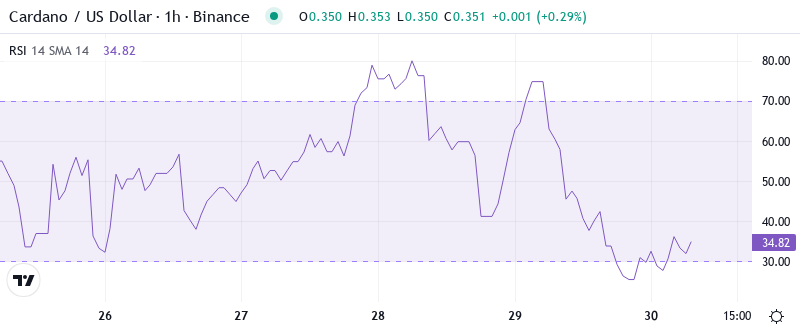
What is interesting is the RSI behavior during this fall – the daily reading currently at 31.5 marks the first real oversold condition since the market-wide washout in August. This has historically been enough to spawn relief bounces in ADA, with readings of a similar fashion in both August and October resulting in 20-30% bounces over the following days. The weekly RSI at 42.1 meanwhile highlights there is room to the downside still on the higher timeframe, therefore, this could be a reset on the lower timeframe rather than a major bottom.
Therefore, this drop has not cleansed the market of good buying opportunities, on the contrary, plenty of quants must likely rethinking positions right now. Our advice for everyone is the same – no leverage, no emerging coins, no low caps, until the market shows true evidence of a sustainable rally.
ADX at 37 Confirms Sellers Control the Trend
When it comes to self-defeating predictions, it’s hard to top the cryptocurrency crowd. For years, these zealots have been forecasting that Bitcoin, Ethereum, and other digital assets would soon displace gold, the world’s most enduring store of value. They predicted that such cryptocurrencies would soon replace all world currencies, rendering central banks and governments superfluous._RTC
It is advisable for day traders to adjust their strategies according to the prevailing market conditions. In such a strong-trend environment, fading the bounces is a more productive approach than buying the dips. The prevailing strength in the trend indicates that any corrective/relief upside moves are likely to encounter strong overhead supply, thus positioning for rapid trades have higher chances of success than having a short-term outlook. Range trading becomes an option only if ADX once again drops below 25.
20-Day EMA at $0.38 Becomes First Resistance After Support Flip
Looking on the downside, short-term support zones lie at $0.35 (100-day EMA), $0.33 (200-day EMA), and $0.31. A daily candlestick close below these supports would likely validate a test of the June low ($0.27) and force a retest of the 200-day EMA.
The way these moving averages are stacked, however, the 10-day EMA is on pace to cross below the 20-day EMA in a bearish fashion, indicating that any bounces are likely to get rejected at this first level. Given the current buy volume from last week’s breakout, the compressing between the 10 and 20-day EMA remains slightly lower than some of the more aggressive targets we laid out earlier. Failing to maintain trading above the 10-day EMA and reclaiming the 20-day EMA would likely send Cardano retesting the $0.20 range lowest most sustained uptrend occurred.
Support Architecture Weakens as $0.40 Transforms Into Resistance
There is strong resistance ranging between $0.38 and $0.43. The previous support level of $0.40 should act as a psychological resistance as well; longs who were stuck in December will try to get out even. The monthly pivot of $0.47 is far away in today’s auction.
There seem to be few support levels once $0.35 broke – first, the weekly low of $0.34 stands as the next level to potentially rebound, then the higher-traffic August low around $0.32. according to the Volume Profile Indicator, a vacuum exists between the current point and the psychological $0.30 handle, meaning that any bearish extension could progress easily. The monthly S1 Pivot Point of $0.33 synchronizes with horizontal support, representing a feasible objective.
The market structure became bearish after falling below $0.40, which had been solid support throughout Q4 and is now capping all relief rallies, and the shift from support to resistance often signals intermediate-term trend changes, meaning ADA will need either more time or a major new catalyst to fix the charts, and thus far, the stablecoin news hasn’t been enough to offset the technical damage.
Bears Target $0.32 as Oversold Bounce Setup Develops
In order to indicate that the selling pressure may have exhausted, bulls would need a daily close back above $0.38 (20-day EMA). For that to be considered a bottom potential, it would need to be dovetailed by RSI divergence and declining ADX. Fundamentally, a “game-changer” as described by Hoksinson with the stablecoin legislation could be the catalyst, but technically speaking, repairs take time.
If you want to see a bearish continuation, observe how ADA reacts if Bitcoin decides to dip further. If the previous couple of days are any indication, Cardano could plunge towards $0.32 newly formed support, followed by the 2020 high at $0.30. The first resistance lies at $0.36.
Considering the daily RSI was oversold at the time and the weekly support remained solid at $0.34, we stated that the most likely short-term scenario would involve an attempt to bounce in the $0.36-0.38 area before heading lower again if that level acted as resistance. The same holds true this week. The current technical state of the chart is such that a dead cat bounce is not likely to be sufficient for repairs, so discciplined patience is required by both bulls for a better low entry and bears anxious to short the next upthrust.