Monero Surges 59% in Three Months as Privacy Demand Intensifies

Market Structure Shifts Higher
- Monero is currently trading at $455.22, which is an impressive 59% increase in three months
- The narrative around privacy coins gains more traction after the EU gives the green light to plans for a privacy-oriented digital euro
- There is also increasing technical momentum, with the RSI sitting at 60 and the ADX recently crossing 22
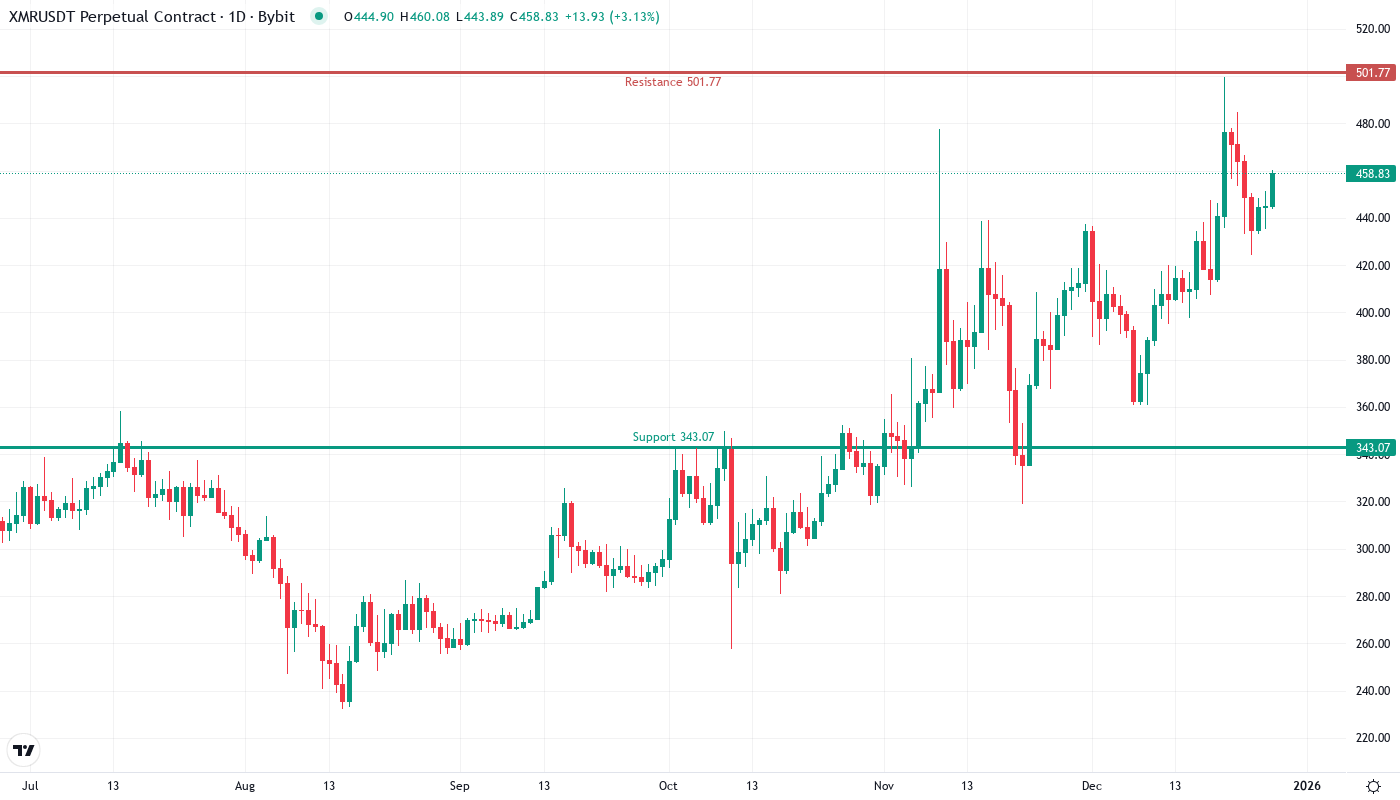
Monero’s latest bullish wave saw prices lift 14.2% over the past month to $455.22, as European and Russian privacy-focused developments captured the markets’ attention. The emerging privacy-oriented narrative has reached a global scale, and Europe is at the center of it. In November, the EU approved a digital euro version designed with privacy in mind. Uptrend-rallying news crossed through the Monero market, signaling institutional focus on transactions’ privacy – a concept XMR has championed since its launch. The quarter saw prices extend 59% higher as fresh money flowed in. The main question for traders now is: can they sustain momentum above $405, which was formerly a significant resistance level for XMR until December?
| Metric | Value |
|---|---|
| Asset | MONERO (XMR) |
| Current Price | $455.22 |
| Weekly Performance | 3.26% |
| Monthly Performance | 14.17% |
| RSI (Relative Strength Index) | 60.0 |
| ADX (Average Directional Index) | 22.6 |
| MACD (MACD Level) | 15.65 |
| CCI (Commodity Channel Index, 20-period) | 77.51 |
Momentum Holds Steady at 60 – Room for Further Gains Without Overheating
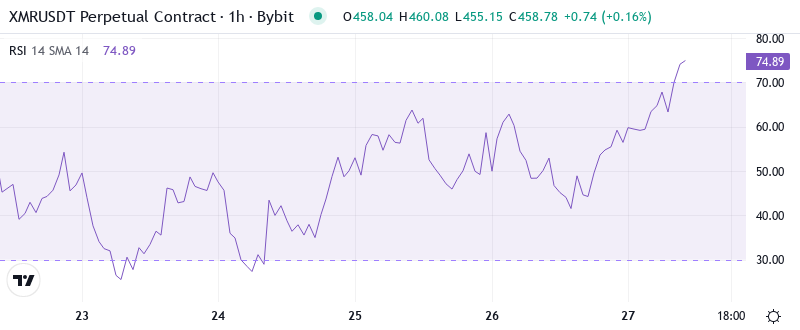
The relative strength index is at 60 on the daily timeframe, putting Monero in solid bullish ground and far below the overbought levels that usually signal the end of a rally. This healthy reading indicates that the 59% rally hasn’t pushed all buyers out of the market, especially since Monero has climbed broadly in a period when privacy coins have faced less selling pressure as investors focus on other areas of the crypto realm. A similar reading appears on the 100-period 4-hour chart, capturing the 2% rally from the April 18 low of 401.64.
The same momentum set up was seen in September with RSI crossing 60. Monero approached $500 but the rally lost steam as RSI neared overbought conditions of 75. For swing traders, the current setup with RSI close to 60 offers about 10-15 points of upside momentum capacity before hitting historical reversal zones. More importantly, two new influential fundamental catalysts, the EU’s digital euro privacy hype, and Russia’s retail crypto liberalization were not present during the past rally peaks, meaning fresh legs could carry this momentum cycle higher than usual.
ADX at 22.6 Confirms Early-Stage Trend After Months of Consolidation
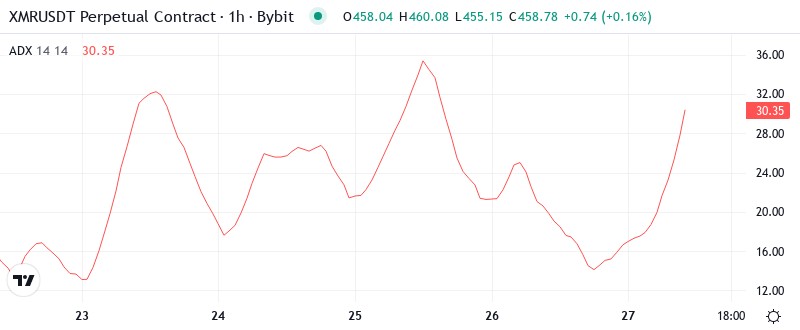
The ADX at 22.6 suggests that Monero’s trend is changing from the choppy consolidation that prevailed in late 2024 to low-momentum but sustained upticks. The Russia headline also triggered Monero’s first close market structure above the 200-day average around 172, opening the door for further positive momentum. ADX measures the strength of trends in a market – low readings indicate indecisive environments, whereas high readings tend to accompany strong trends. A reading above 25 is generally considered a trending. ADX is only one component of the TrendFlex board and is not a reliable buy or sell signal on its own.
In simpler terms, when ADX is low, it’s time to go, meaning it’s a good time for traders to switch gears from betting against the prevailing trend to betting with the trend. ADX readings below 20 indicate the trend’s weak and traders would be best off devoting their energies elsewhere. However, when ADX is at an inflection point and rising, it can indicate that a “real trend” is in development; in that case, traders will want to be in trend-following mode. If ADX measures 25 to 40 for the next several weeks, which appears to be the most likely scenario, based on Monero’s ADX behavior in recent history, then it’s off to the races.
50-Day EMA at $405 Flips to Support After December Breakout
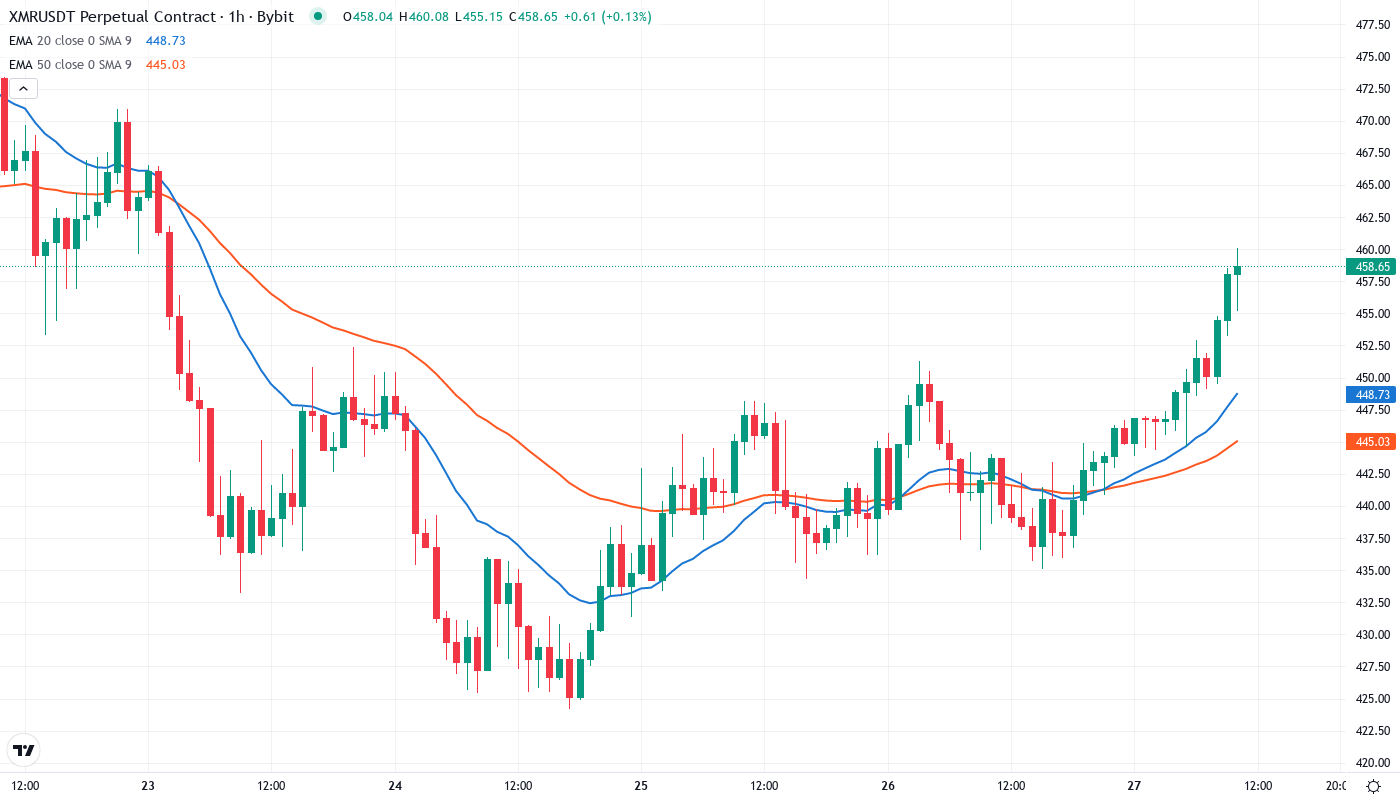
The 10-day EMA retraced to test trend support last week and the 20-day and 50-day EMAs have started to gradually converge on the 10-day moving average, reflecting an easing bullish trend; this would also likely attract bids on a test. MACD remains perched above the zero line and hugging the signal line while the RSI probes overbought territory, both mildly encouraging readings to the bulls. Whipsaw bulls should keep an eye on the DMI, as it dominates by a decent margin (-DI and ADX) over the ADX, while RSI bulls have the higher +DI and +DI/-DI spread.
What is most noteworthy is the squeeze between the 10-day and 20-day EMAs, which are only $12 apart as opposed to $40 during the consolidation. This indicates that buyers are quite determined at the current levels and are not allowing the price to dip much. The 50-day EMA at $405 now becomes the red line that the bulls will have to defend. A daily close below it will indicate that the rally has lost momentum.
Resistance Stacks Between $500 Psychological Level and $568 Monthly High
Resistance can be seen as a ceiling that the price struggles to break above. In this case, Monero shows resistance around the $500 level based on previous price movements and some key technical analysis indicators. It’s like a lid on a pot that prevents the contents from spilling over. The resistance here is quite strong due to various factors such as historical price points, pivot levels, and the highest price seen that year.
Bulls are protecting three different support levels below the current price: first, the current floor at $441 (where the monthly pivot point and the 10-day EMA intersect), then the essential $405-410 area, where the 50-day EMA intersects the December breakout level. The final level of support is at $375, with a combination of the 100-day EMA and the prior round number of psychological support, which capped November’s consolidation.
The configuration looks like a coiled spring between $405 support and $500 resistance with direction likely to be dictated by privacy-focused news flows. The setup obviously favors longs providing $405 holds on any pullbacks – a break would leave December’s longs wrong footed and likely to liquidate rolls down to $375.
Bulls Target $500 Test as Privacy Narrative Gains Institutional Validation
If Monero manages to have a daily close that is higher than $460, it’s possible for the bulls to aim for the $490-500 resistance area, which is the same point where the rally in September ended. It’s the first time there is fundamental ammunition in the form of EU privacy measures and Russian integration with an exchange, which hasn’t been seen in the past, so it could lead Monero to push through the $500 psychological resistance.
If that level gives way, look for possible support near the 200-day EMA at $330. This would still constitute a higher low, keeping XMR in the long-term uptrend.
Considering the momentum oscillators and privacy enhancing drive based proprietary information, Monero is now getting ready to challenge resistance around $490-500. ADX inching higher and RSI nicely placed giving further push to the uptrend and hence, one should always keep in mind $500 psychological resistance and a level that saw the trend reversal in the past.