Chainlink Tests Critical Support as Whales Accumulate 20 Million LINK
Market Pulse
- Despite a 52% correction from LINK’s yearly highs, the persistent accumulation from large investors has allowed LINK to find a strong level of technical support.
- This positions it well to see further upside as the team continues making strong progress on the fundamental side of the business.
- The price of Chainlink suggests that we may be about to find out if cryptocurrency traders view the blockchain-based token as a momentum play or an emerging utility with strong long-term value.
A recent note from J.P. Morgan’s quantitative strategists indicated that institutional investors have been shifting away from momentum plays and into support for liquidity-driven asset classes as the ascent of U.S. Delta-variant cases and Chinese Delta momentum add to global growth equity risk. Whether Chainlink will be dragged lower is hard to say, but it makes sense to have positive exposure to a specific sector with steady growth, strong fundamentals, and providing a unique service that others can’t reproduce.
| Metric | Value |
|---|---|
| Asset | CHAINLINK (LINK) |
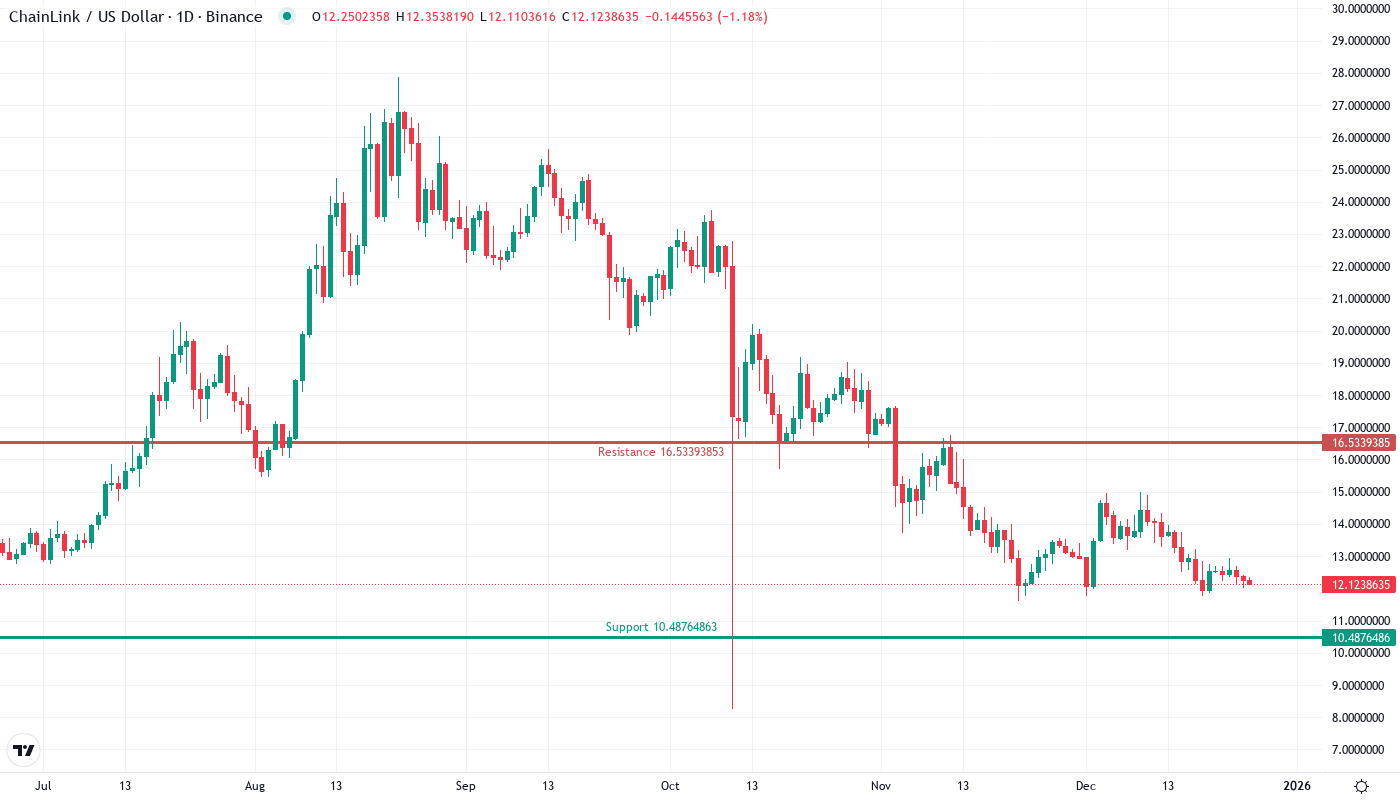
| Current Price | $12.12 |
| Weekly Performance | -1.11% |
| Monthly Performance | -6.52% |
| RSI (Relative Strength Index) | 38.5 |
| ADX (Average Directional Index) | 28.9 |
| MACD (MACD Level) | -0.45 |
| CCI (Commodity Channel Index, 20-period) | -90.13 |
Momentum Exhaustion Signals Capitulation Phase – Room for Recovery Ahead
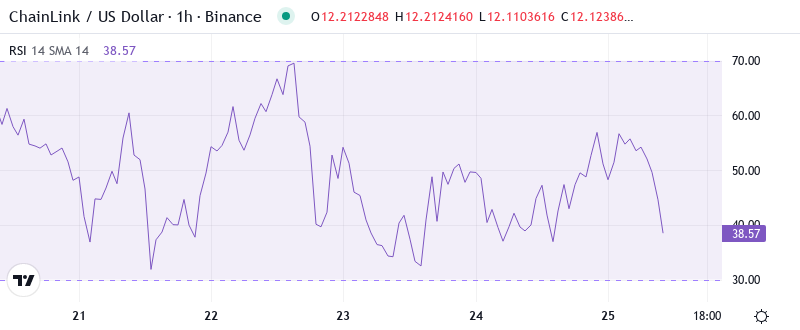
With the RSI oscillating at 38.54, it appears LINK is now firmly within overextended conditions on the daily. This hasn’t been the case since the August shakeout, which let’s not forget, was the event that triggered a near 40% relief rally. The reason we’re seeing overextended conditions here, so soon after dropping 60% from highs, is all due to the sheer rate of sale that dropped us from $20 to sub $10. As mentioned, it wiped out six months of gains in just a few months.
For swing traders out there, this oversold bounce setup becomes more powerful with every retest of $12. The weekly RSI of 37.48 validates the oversold reading on varying timeframes while the monthly RSI of 45.89 suggests we still have room to fall, although haven’t reached those deep washout levels typically seen at bear market lows. Comparable RSI reads in September 2023 led to very important market inflection points, particularly when there was a fundamental reason as is the case currently with emergent tokenization speculation regarding Chainlink oracles.
ADX at 28.92 Confirms Sellers Losing Steam After Extended Downtrend
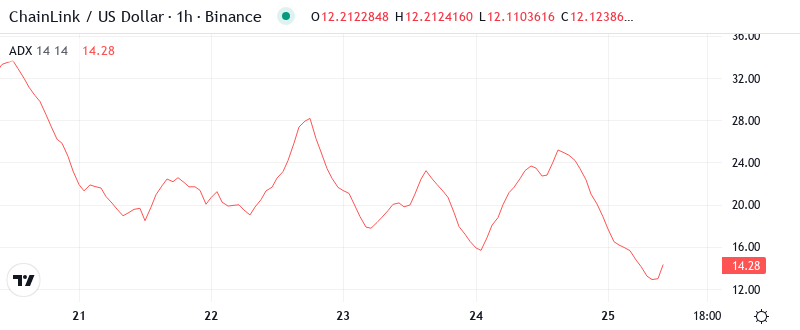
The ADX of 28.92 tells us that while there is a trend in place, it is losing momentum after becoming very overbought above 35 last month. In simple terms, the selling that has pushed LINK from $16 to $12 is running out of gas, which sets the stage for a reversal to become more likely especially with institutional buyers present at these price levels.
The shift from trending to potentially ranging makes the overall market structure a perfect environment for this play. When ADX fades from levels above 30 back towards 25, it frequently indicates that the “easy” part of the trend has concluded, and that the asset is entering a consolidation phase. As a result, day traders should shift strategies from trend-following to ranging-trading tactics, with a focus on the $11.75-$12.50 region that LINK has been oscillating within over the past week as Chainlink’s key whales absorb 20 million of these crypto assets.
50-Day EMA at $13.96 Becomes Next Resistance Target for Bulls
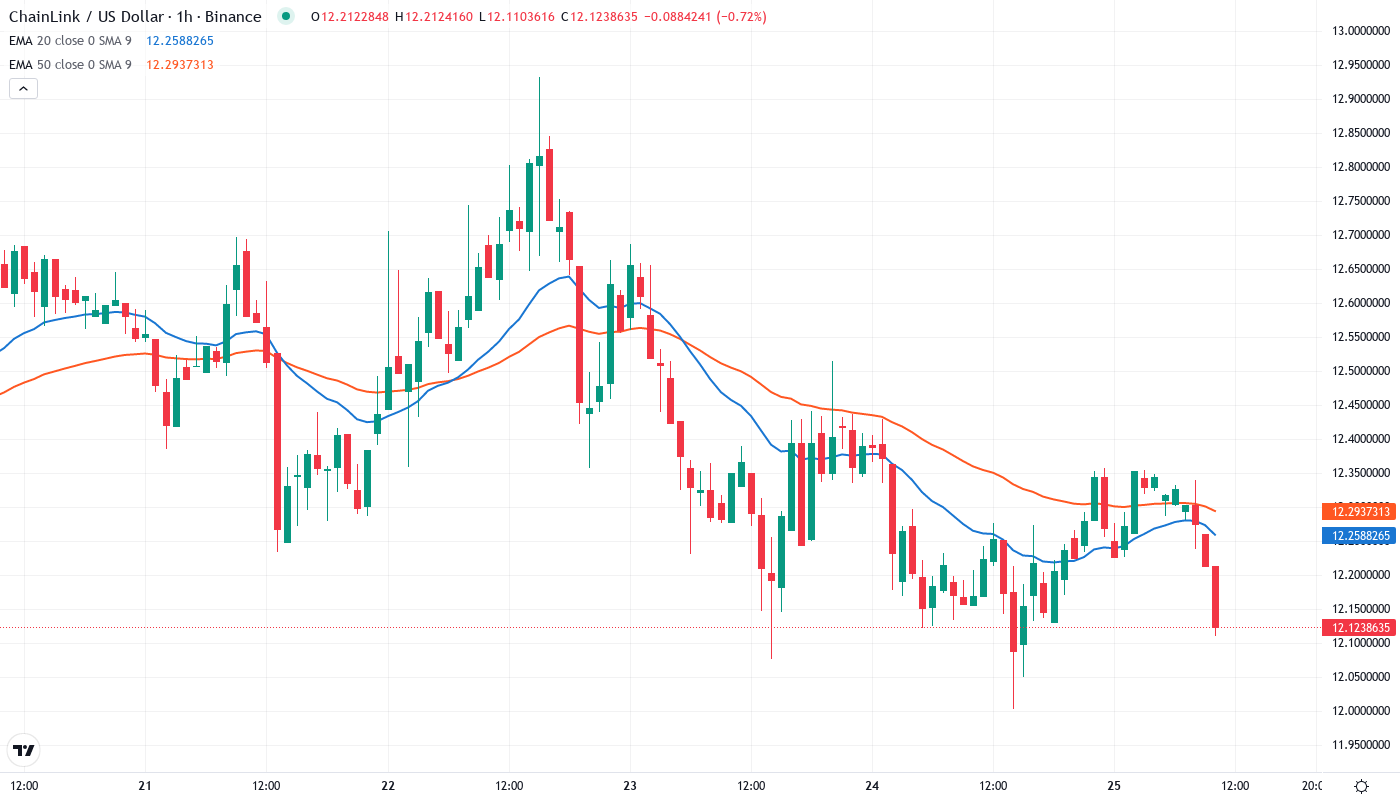
The 50-day day moving average is considered a key indicator when it comes to market trends. The 50-day EMA has been a point of resistance for the price of LINK on three previous occasions. The first was in and around the time the massive crypto market crash occurred on 25th November and the next was during the previous rally attempt. The 50-day EMA tied in with a horizontal resistance at $14, regardless of these bearish falls.
More indicative, however, is the relative positioning of the 100-day EMA at $15.58 and the 200-day at $16.65 – they are both firmly above current price, which continues to confirm that the intermediate downtrend is unbroken at this time. In more positive news, the 50-day EMA has now converted from a more compacted short-term resistance point and is effectively acting as the first upside target in any rally fueled by Swift or Grayscale capital rotation. Bulls will need to recapture this level without any significant delay if the bearish recovery vs. bullish reversal narrative is to be anything more than another source of Twitter entertainment. Luckily, some tokenization based developments should help the bullish cause.
Support Architecture Builds From $10.80 to $12.00 as Whales Defend
The first support level is between $10.80 (monthly S1) and the key psychological $12.00 level, where whales were accumulating. This area held the price six times in December, and each test was met with sharply increased volumes, which is a clear indication of institutional buying. Lower, the nearest monthly pivot point support is located at $8.43.
There is heavy resistance to the upside between the daily pivot at $12.29 and the weekly R1 at $13.37. Similarly, the monthly R1 at $14.07 meets with the 50-day EMA to give another combined resistance point. Taking all these resistances into account, further upside looks somewhat unlikely. Buyers will become exhausted and begin to take profits as the price approaches these levels.
The most obvious technical feature here is the narrowing range between support and resistance – a classic compression pattern which more often than not resolves with a 15-20% move in one direction or the other. The structure of this market slightly favors the buyers as long as the $10.80 floor is maintained on any retest. Each subsequent bounce from this zone adds further confidence for the bulls, with the backdrop of Chainlink’s continued expansion in institutional tokenization projects providing the fundamental narrative often required to backstop a technical breakout.
Whale Accumulation Meets Tokenization Catalyst – Path to $14 Emerges
Bulls need a clear daily close above $12.85 (20-day EMA) to prove that the oversold rally is sustainable. When this level is broken, the 50-day EMA on the daily timeframe will be $13.96, while the monthly R1 will be the first resistance zone. Both whale accumulation and the current tokenization craze of Swift can push this forward, particularly if overall crypto markets tend to remain solid.
The setup is invalidated on a close below $10.80 on volume, which would trap recent accumulation and probably trigger stops down to the $8.43 monthly pivot. However, based on the extent of the recent decline and oversold indicators on all time frames, that would seem less likely overall, but that is the key invalidation. Finally, be aware that a weekly close under $11.75 negates the recent accumulation.
Considering the whale accumulation evidence, oversold technicals, and token-related fundamental developments, we predict that LINK will stabilize in the range of $11.75-$13.00 as it gears up for breaking through the $14.00 level of resistance. The combinatorial effects of large investors and utility growth offer a very attractive risk-reward profile for the long-term investor so long as you can tolerate the short-term swings.