Sui Finds Floor at $1.41 as ETF Filings Stack Up Against December’s Collapse
Market Pulse
- SUI recovers from $1.31 weekly bottom to $1.41, stopping a 54% monthly collapse
- Canary Capital and Bitwise ETF applications indicate multiple institutional interests again
- Overextended rebound supposedly ongoing, although substantial resistance is expected to come
The recent price movement of Sui has confirmed that it has crashed by 54.88% in the last month. The token from its highest price level of $3.17 made on February 9 and went straight down to $1.31 on March 2, thus indicating the bottom. For this Sui made it December low at $1.32. However, Sui made some recovery to $1.41 as trading of March 17th is currently over. The rally will remain open to challenge until the resistance of $1.60 qnts broken. It is no coincidence at all that this rally started right around the time that larger institutional buys hit the market with Canary Capitals $SUIS ETF filing for Nasdaq.
| Metric | Value |
|---|---|
| Asset | SUI (SUI) |
| Current Price | $1.41 |
| Weekly Performance | -1.04% |
| Monthly Performance | -7.86% |
| RSI (Relative Strength Index) | 40.3 |
| ADX (Average Directional Index) | 25.7 |
| MACD (MACD Level) | -0.07 |
| CCI (Commodity Channel Index, 20-period) | -91.11 |
RSI at 52.27 Signals Neutral Territory After Oversold Plunge
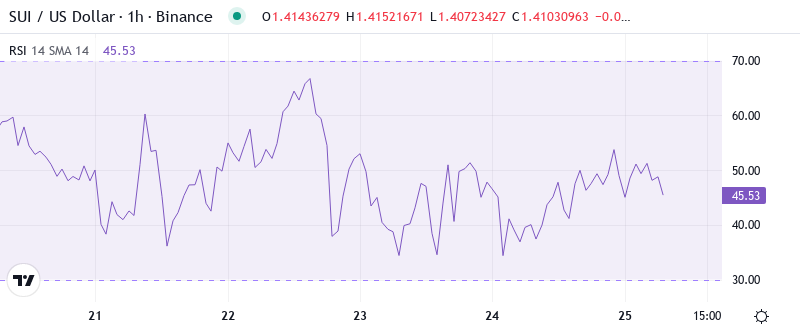
With the oscillator reading at 52.27, analysts believe momentum is returning to a more balanced state of affairs after what likely was a capitulation phase. This neutral reading comes after weeks of oversold pressure that arrived with a 69.4% tumble from six-month highs. Comparable RSI bounces from extremely oversold readings in cryptos frequently come before consolidation periods or the beginning of more extended bounces.
What is interesting to note is the reaction of RSI to the recent ETF news catalyst – it moved from the oversold region of below 30 to the current neutral zone without entering the overbought territory. Therefore, for a swing trading viewpoint, this neutral RSI indicates that the momentum can gather in either direction, however, the sharp bounce from the oversold zone indicates that the buyers are jumping in aggressively at these levels.
ADX at 25.73 Shows Trend Gaining Traction After Consolidation
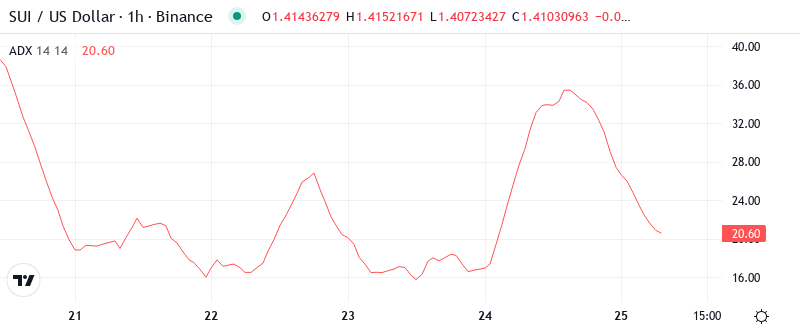
The trend strength indicators show something interesting going on. With a reading of 25.73, the ADX input suggests that the trend is growing but is not particularly strong right now. In simplest terms, being in this vicinity suggests that SUI is shifting from the choppy, non-trending behavior seen during the recent consolidation phase and is starting to establish a trend.
As the ADX rose from the low teens in the consolidation phase, this is seen as the beginning of a new trend. In simple terms, the ADX suggests we are moving from a non-trending environment to a trending one. As such, day traders will want to adapt their intraday methods as increasing ADX readings could signal that trend-based trading can become more effective than range-based approaches used in low readings beneath 20.
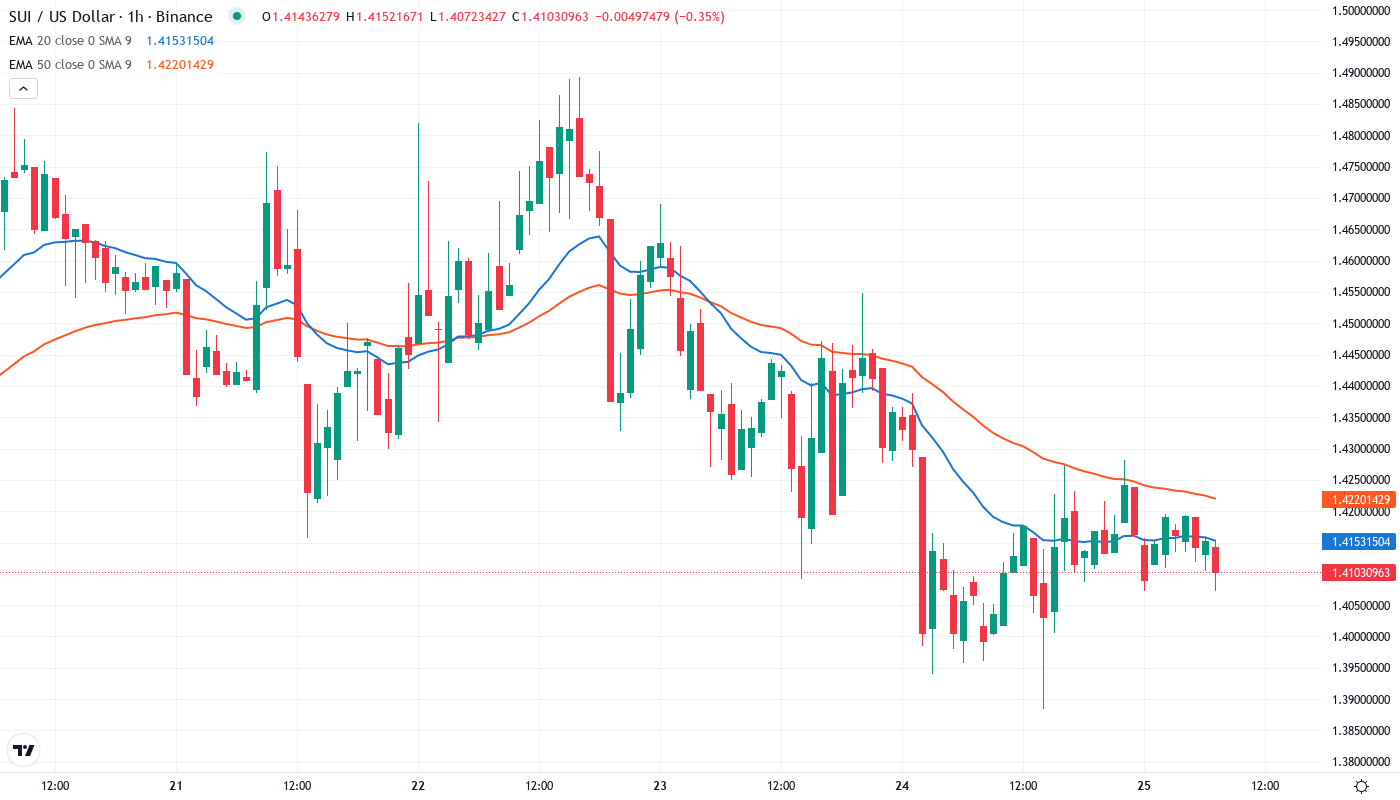
20-Day EMA at $1.49 Becomes First Major Resistance Target
When it comes to evaluating the relative strength of a stock, traders and analysts often turn to the 14-day RSI (Relative Strength Index) when focusing on a short-term view. A reading above 70 suggests overbought conditions._STARTED_UC.ALL_CAPS_ The RSI stands at 47.13. This suggests the latest price-level is indicative of neutral conditions for the stock.
When we compare the risks and rewards, we believe taking on the risk of a failed break above the noted resistance is not worth the two to four-cents savings, while the 50-day MA currently at $1.59 presents the most logical base for a protective stop on new speculative longs. How many times the 20-day EMA is tested as new support also becomes a vital tell regarding fund responses to this week’s quarter-end mark-up. For now, we remain skeptical on the increasing ETF demand impact, in terms of generating a major recovery rally.
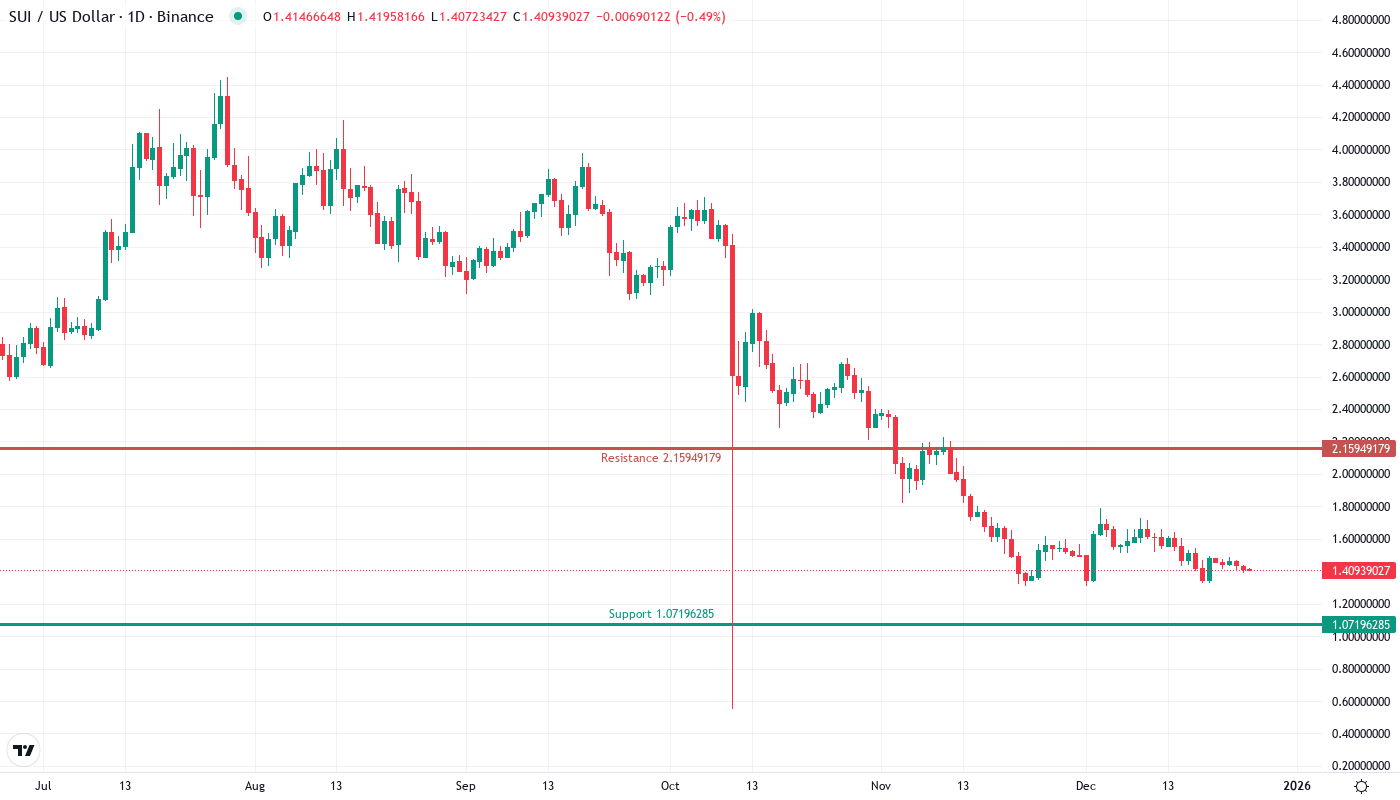
Support at $1.31 Holds While Resistance Stacks From $1.45 to $1.71
The closest support zone emerges around $1.20, just above the December low. The momentum to the sell-off will likely gather steam if the selling pressure overwhelms at this crucial level. Further down, the approximate January 22 low at $1.10 coincides with the ascending trend line originating from October 2020, where buyers may return. Any decisive close below that level could invalidate the bullish bias.
Bulls are protecting the weekly low at $1.31, which has become a critical support level and has held numerous retests. The support line has strengthened, as the series of ETF filing news has helped to establish a fundamental support level. To the downside, the monthly low at $1.31 is the absolute level the bulls must defend, a break and sustained move below would likely see the psychological $1.00 come into play.
The current weekly candlestick pattern imitates a bullish hammer pattern off the $1.31 shelf. This loop-hole candle signals bear exhaustion and is strongly confirmed by the RSI divergence. We should see dip buyers support price and inflect for a multi-month recovery wave higher.
Bulls Require Convincing Close Above $1.55 to Confirm Trend Reversal
In order for the bulls to get the upper hand, they must close the daily above the 50-day EMA at $1.55. If they can manage that, we could assume the oversold bounce has more room to the upside, with $1.71 as the first target. The continuous ETF filings and Mysten Labs’ integration in Bhutan will serve as solid foundations for more than just technical bounces.
If the price is rejected at $1.49, and we break back below $1.31, we will face a bearish scenario. In this case, new buyers who speculated with the ETF will be trapped, and positions will likely be flushed out, with the price dropping to the psychological $1.00 level. If we fail to maintain the $1.31 level after testing it several times, this will indicate that not even institutional investors can stop the price decline.
Considering the oversold bounce meeting actual institutional news, the most likely immediate-term scenario is for SUI to consolidate between $1.31-$1.49 as it digests recent wild swings. The handful of ETF filings provide a nice base, but price action needs to settle after a 55% monthly nosedive. We anticipate this rough range-bound action in the near term before a clear break higher or lower occurs.