Cardano Darts Through Monthly Lows as Starstream Launch Meets Quantum Computing Concerns
Market Pulse
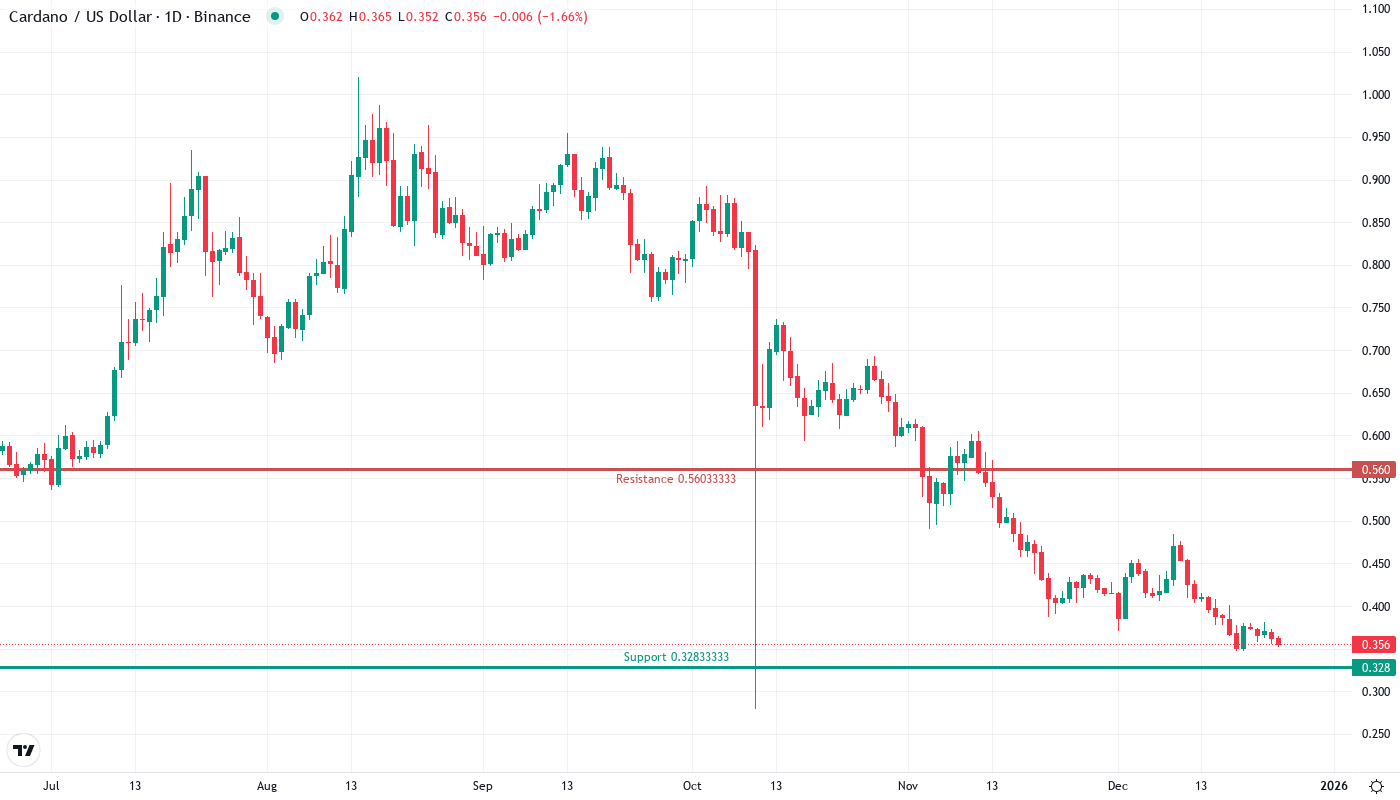
- ADA is testing a six-time defended support level after a 13% drop in two weeks.
- Modest daily gains observed despite bears crossing the 20-day moving average.
- Oversold technicals and foundational developments could lead to a bounce.
Cardano’s ADA is testing a six-time previously defended support level after shedding 13% in two weeks. Price growth continued this week despite bears taking forward control, with a second short green candle showing modest daily gains. A failed weekend breakout has since been countered by bears, who crossed the 20-day moving average ($0.493) on Monday morning. Although unsuccessful, longs are profiting from forced defenses of that $0.356 support, as oversold technicals and mounting foundation developments could lead to at least a bounce.
The latest Cardano price crash has trapped bulls for the third month in a row. Surprisingly, for most of September, ADA recovered above $0.43, obfuscating the dismal performance. False breakouts trigger sharp intraday drops and may have discouraged holders from the 214% rally since July. One thing is certain: trapped bulls are forced to liquidate long positions in anticipation of triggering cascading stop-loss orders.
| Metric | Value |
|---|---|
| Asset | CARDANO (ADA) |
| Current Price | $0.36 |
| Weekly Performance | -7.53% |
| Monthly Performance | -12.96% |
| RSI (Relative Strength Index) | 35.4 |
| ADX (Average Directional Index) | 36.6 |
| MACD (MACD Level) | -0.03 |
| CCI (Commodity Channel Index, 20-period) | -100.26 |
RSI at 35.44 Matches Historical Bounce Zones
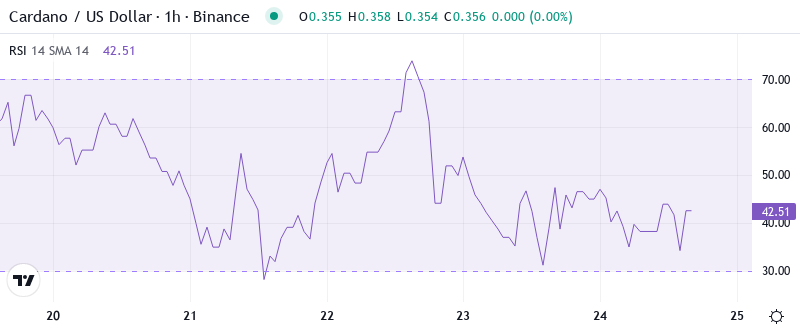
The relative strength index is at 35.44 on the daily timeframe, which enters oversold conditions that in the past have signaled notable local bottoms for ADA. August and early December also saw similar over-extensions, after which 20-30% relief rallies transpired. These upward moves did not have the added narrative or demand-base of further cross-chain utility upgrades, however. The weekly RSI is slightly lower at 31.59, reinforcing multi-timeframe oversold territory, which tends to conclude sell-offs.
What is interesting to note is that RSI has not moved much with the recent Starstream announcement. Positive news did not excite the market enough to change the recent trend, sellers on a small cap stock are in control. For the swing traders out there, this could be of interest with the combination of being deeply oversold and having some fundamental news in the pipe with Midnight integration. But, the likelihood of a whipsaw effect has to be high and you need to be patient and wait for the momentum to switch and see a gathering above the 40 level on the daily bar.
ADX Climbs to 36.62 as Downtrend Gains Steam
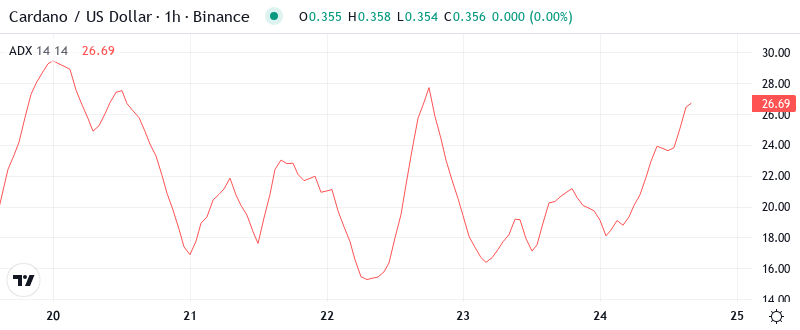
When looking at trend strength, the ADX reads 36.62, which indicates a mature downtrend that is increasing in conviction rather than waning. Trends are considered quite strong at this level, but they are also getting up there in the range that reversals tend to emerge — especially if paired with oversold momentum readings. This reading does confirm that we have transitioned from the back-and-forth chop and consolidation of December and into a more trending environment. For the bulls, the trend has obviously been all too much to the downside.
Simply put, an elevated ADX suggests that range-trading strategies should be set aside in favor of trend-following strategies. It’s likely that many day traders have noticed the extent to which market leaders are widening the gap between winners and losers in this environment – another feature of a meaningful trend. The best tactic in this regard may simply be to recognize weaker stocks as shorts and leave it at that.
50-Day EMA at $0.454 Becomes Key Resistance After Support Flip
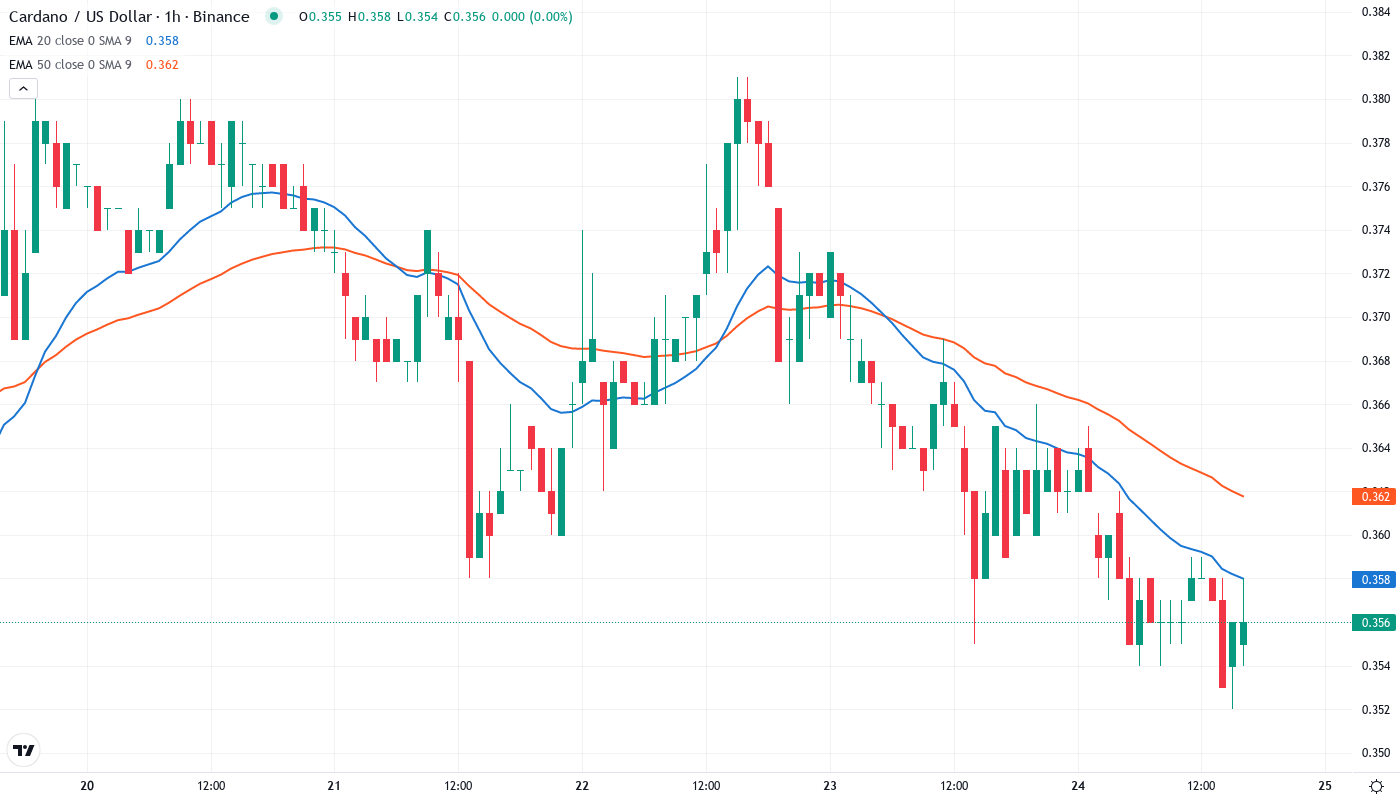
Looking forward, if ADA is to have any chance of reversing the current downtrend, the price must reclaim these key levels as support to reduce the likelihood of further downside pressure. The first test will be the 10-day EMA ($0.374), followed by the 20-day EMA ($0.392). However, the 50-day EMA ($0.454) will be the most critical as it’s currently acting as a robust resistance.
More ominous signs come from the daily RSI, which implies that the bottom has not yet been reached. The price was creating higher lows, but the momentum oscillator was trending downwards, suggesting that the early warning system for ADA might have flashed red. A lack of positive divergence in the RSI makes it easier for oversold conditions to persist before reaching liquidation panic levels. In the weekly chart, the next plausible support would be the 55-week EMA at $0.316.
Support Stacks at $0.347 While Resistance Clusters Near $0.48
The nearby support zone focuses on the monthly low at $0.347, a test that has been run six times since June and that is still finding buyers despite the quantum computing signal from Hoskinson. The subsequent meaningful support level arrives at the $0.30 mark, leaving room for an oversized drop if $0.347 is breached. Volume profiles signal accumulation at these levels, reflecting strong institutional interest in Cardano’s cross-chain functionality.
There’s significant resistance near the $0.467-0.484, $0.50 and $0.513 levels, as sellers have taken firm control during every rally over the past three months. Due to this, it’s play defensively until it proves in a position to clear these levels.
Importantly, the market structure has continued to form a pattern of lower highs since November, although it’s important to notice that support at $0.347 has held firm after being tested multiple times. The tightening price action between increasing support and decreasing resistance levels indicates that a breakout is nearing, with catalysts likely being the overall cryptocurrency market activity or more news within the Cardano ecosystem.
Bulls Need Decisive Close Above $0.42 to Shift Momentum
Buyers, on the other hand, need to tread cautiously until the early March low of $0.326 is breached. If this level fails to uphold, further downside risks toward the critical support at $0.298 could materialize. A decisive close beneath here would generate further panic selling, which may drive Cardano toward the 200-day SMA at $0.244.
If the monthly support breaks then a drop to the familiar weekly consolidation low would begin to look likely, at around $0.25 – a 27% dump from the $0.347 support. This is further supported from a technical perspective by a volume profile of the visible range (VPVR) which shows a high level of interest in the $0.28 region.
With RSI readings now at their most oversold since July 20, aggressive traders with sound risk management controls in place may consider accumulating for near-term price stability and mid-term twofold capital appreciation. The confluence of six price support tests at $0.347 and increasingly positive fundamental and technical research including impressive knowledge discovery with Starstream likely makes the $0.35-0.37 area the safer level to add long exposure for most. Longer-term, ADA remains very attractive, with several catalysts in place to provide for potentially vigorous directional migration progress late this autumn. Embrace the uncertainty perhaps because markets love surprises.