Avalanche (AVAX) Tests Critical Support as Purpose-Built Chain Strategy Gains Momentum
Market Structure Shifts Lower
- AVAX fell by 18.3% over the week after being pressured lower from the December double top and recent lows.
- The blockchain Gamestarter has launched, showing real fundamental investment inflows.
- NFTs, royalties, and staking as a service drive utility.
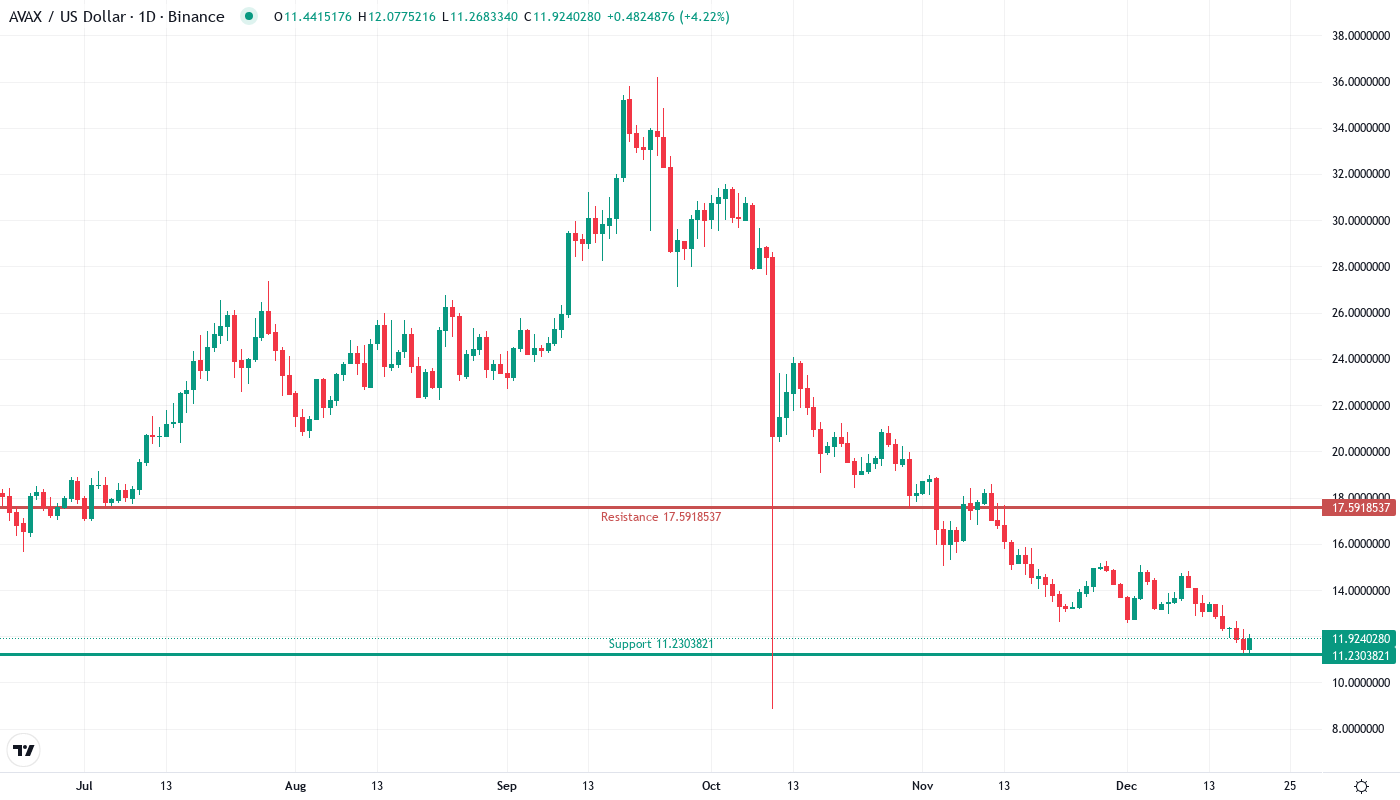
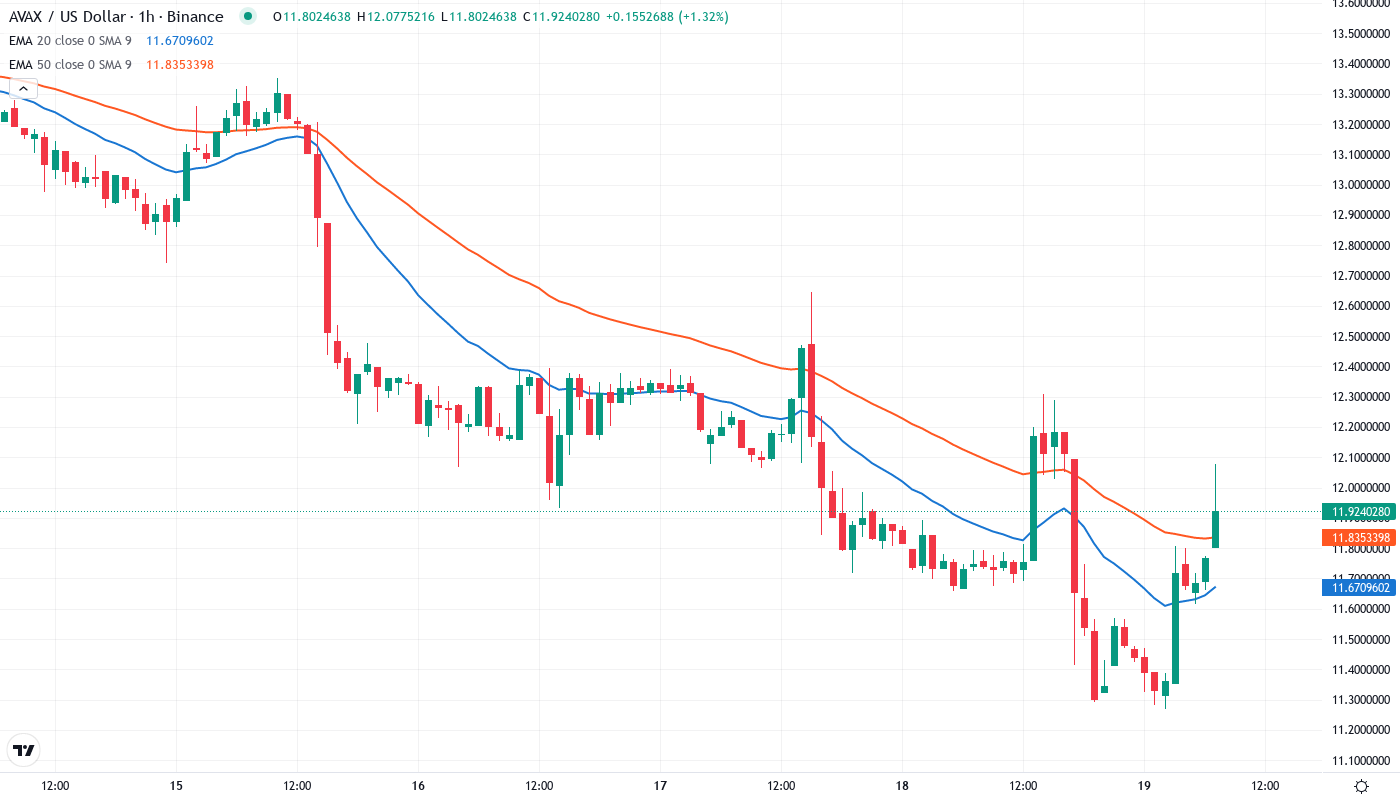
Avalanche dropped 18.3% over the week, giving up nearly four weeks of gains as the entire crypto market went on the back foot. The punishing fall from December’s spike high at $15.26 to current levels around $11.91 occurred despite constructive ecosystem news, such as the launch of the CROSS platform by Gamestarter and real-time music royalty use cases on the network. The key question for traders is whether bulls can protect the important $11.27 level that anchored price throughout November, or if bears will manage to break lower to try the annual lows.
| Metric | Value |
|---|---|
| Asset | AVALANCHE (AVAX) |
| Current Price | $11.91 |
| Weekly Performance | -11.28% |
| Monthly Performance | -18.28% |
| RSI (Relative Strength Index) | 36.7 |
| ADX (Average Directional Index) | 33.1 |
| MACD (MACD Level) | -0.86 |
| CCI (Commodity Channel Index, 20-period) | -155.38 |
Momentum Exhaustion Signals Capitulation Phase
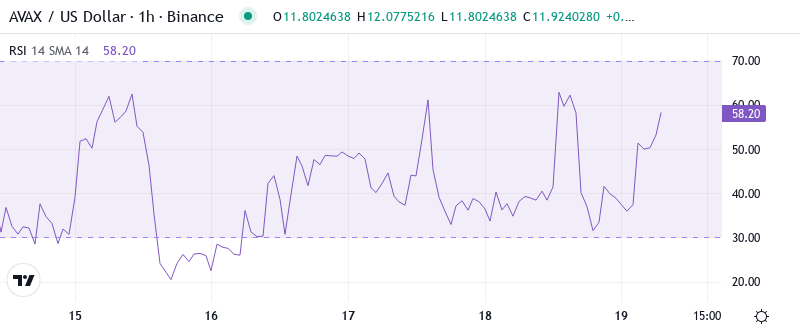
The Relative Strength Index (RSI) is an indicator used in technical analysis to assess the changes of a security price. The current RSI is 36.67 on a daily timeframe, showing the first time this reading is in the oversold range since last August when a 40% rally was seen. The RSI has dropped rapidly from overbought levels (above 70) just two weeks ago. This was one of the quickest collapses of momentum for the AVAX. When the RSI is less than 40 and possesses similar readings below 40, it has usually indicated important local lows. Positives such as the recent solid adoption of purpose-built blockchains are sure to give such signals of the catalyst.
Therefore, it makes sense for swing traders to get positioned quickly in hopes of catching a similar mean-reversion surge out of this latest one. As eager as developers and early adopters are to ditch AVAX, widespread real-world usage will likely still require several years so it’s still quite early in the game for Avalanche.
ADX at 33.10 Confirms Mature Downtrend Nearing Exhaustion
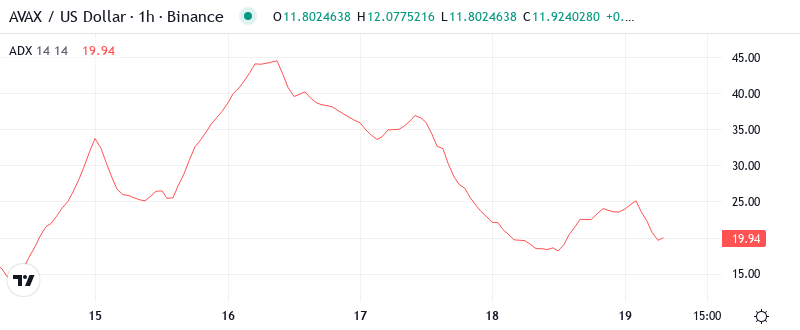
With the ADX at 33.10, the downtrend has been strong but it could also be getting long in the tooth. A reading above 30 simply means it’s real selling and not just sideways choppy action, which obviously confirmed the 64.7% selloff from the annual peak. In simple terms, it’s the danger zone where trend chasers (and for lack of a better word) most of the profit out of their move, and counter-trend setups begin to look interesting for quick players.
Based on backtests, this article believes a reasonable entry in the current environment would be a long position initiated at 103k sats with a stop below 100k and a target of 120k sats for a near-term move.
20-Day EMA at $13.77 Becomes First Recovery Target
The daily RSI is within a bear flag, but there is no sign of bullish divergence following the recent bounce from oversold conditions. AVAX is in desperate need of a near-term catalyst to prevent another leg down as the previous support zone near $11 becomes fresh resistance. If that level fails to hold, the double bottom target of $7.40 is a likely destination.
The bearish weekly tenkan-sen and kijun-sen cross at $15.79 is another potential point of resistance, with the 0.5 fib level now acting as support just below these key technical levels.や(50EMA) that previously sat below the technically important $14 level. The daily RSI remains firmly in bearish territory after a short bounce from oversold levels at the end of last week, with asset prices typically failing to recover meaningfully from oversold conditions during bear markets.
$11.27 November Low Anchors Critical Support Architecture
There is strong resistance above its 20-day EMA of $13.77 up to December’s high of $15.26. Its failure to maintain a level above $14 on many occasions has formed resistance. The initial resistance level is found at the 10-day EMA which stands currently at $12.50. Further up, the short-term longs that entered last week are likely to brake even and exit the positions in the $13.77-$14.00 region.
Bullish traders will see the December high at $13.17 as the initial level that needs to be reclaimed to keep the channel moving higher. A close above here will allow the measured move target at $13.58 to be published. Protecting the minimum downside target at $11.27, there was a two-week close last November at $11.19, worn this week for the February contract.
From a high time frame perspective, AVAX price action is clearly in a downtrend, which indicates that bearish potential remains significantly more than the upside. Buyers have been able to rally the price back up into a position of potential threat. Given the chart structure and the broader trend context, this whole region makes sense as the ideal resistance area to mark the top of a right shoulder for a larger head and shoulders pattern on the daily AVAX/USDT chart.
Bulls Require Reclaim of $13.77 to Shift Momentum
In order to neutralize the bearish structure and give room to potential trend reversal, bulls must guarantee a daily closure above the 20-day EMA at $13.77. This will catch the aggressive shorts of this week’s break, while the expanding Avalanche ecosystem with purpose-built chains will provide solid ground for the recovery. The momentum traders looking to capitalize on any relief rally could aim for the $15.22 next major resistance.
The bearish scenario comes into play if the price clearly breaks below the $11.27 support accompanied by strong volume, which would confirm the double top formation. In this case, the price may face little to no support on the way down to the yearly lows around $8.75. This could lead to a final shakeout of bulls that bought the dip in November in a cascade of capitulations pushing AVAX to the lowest levels since the end of the 2023 bear market.
Considering the current momentum, the favorable circumstances in the broader crypto market, and the company’s success in attracting big-name applications and businesses to its network, Avalanche remains more likely to have a six-figure market cap by the end of the year than not. Realistically, it probably shouldn’t trade for a discount to competitors like Cosmos at this stage. However, investor sentiment on these markets swings more drastically than it does on pure retail speculation wild cards, which could continue to trend against AVAX amid the chaos.