HBAR Darts 10% Higher as CME Validation Meets Technical Support at $0.107
Market Structure Shifts Higher
- Price bounced decisively from six-month lows at $0.107, climbing 10.2% in three days
- CME’s regulated pricing feed announcement sparked institutional interest amid oversold conditions
- Technical indicators align for first time since October, suggesting trend exhaustion near completion
Hedera’s HBAR staged a sharp recovery from multi-month lows this week, surging 10.2% from $0.107 to current levels at $0.109 as CME Group’s decision to include the token in its regulated pricing feed triggered fresh institutional interest. The move follows a devastating 61.6% yearly decline that pushed the altcoin deep into oversold territory across multiple timeframes. The main question for traders is: does this bounce represent a genuine trend reversal after months of selling, or merely another relief rally before lower lows?
| Metric | Value |
|---|---|
| Asset | HEDERA (HBAR) |
| Current Price | $0.11 |
| Weekly Performance | -19.32% |
| Monthly Performance | -25.06% |
| RSI (Relative Strength Index) | 28.7 |
| ADX (Average Directional Index) | 29.6 |
| MACD (MACD Level) | -0.01 |
| CCI (Commodity Channel Index, 20-period) | -153.08 |
RSI at 28.67 Signals First Oversold Reading Since August Capitulation
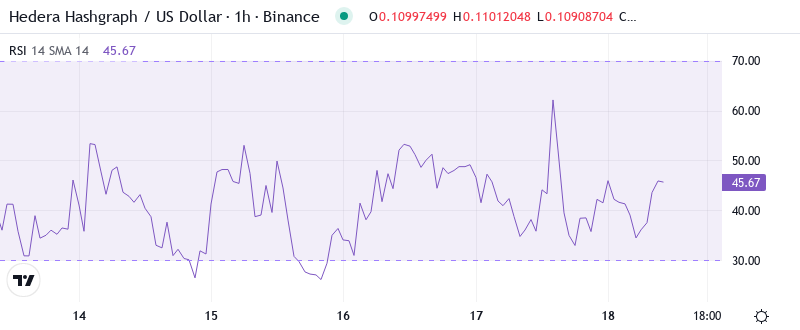
RSI sits at 28.67 on the daily timeframe, marking the deepest oversold condition since August’s washout that preceded a 45% recovery rally. The oscillator has spent eight consecutive days below the 30 threshold – a rare occurrence that historically coincided with significant bottoms in HBAR’s price action. Similar RSI configurations in September and November both resulted in minimum 20% bounces within two weeks of hitting these extreme readings. What’s revealing is how RSI barely budged despite yesterday’s 10% surge, remaining firmly in oversold territory even as buyers emerged. This suggests the momentum reset isn’t complete yet, giving swing traders potential room for continuation if volume confirms. So for position traders, this balanced approach between price recovery and momentum lag means waiting for RSI to reclaim 40 before declaring the downtrend definitively broken.
ADX Climbs to 29.60 – Trend Followers Gain Edge After Choppy Consolidation
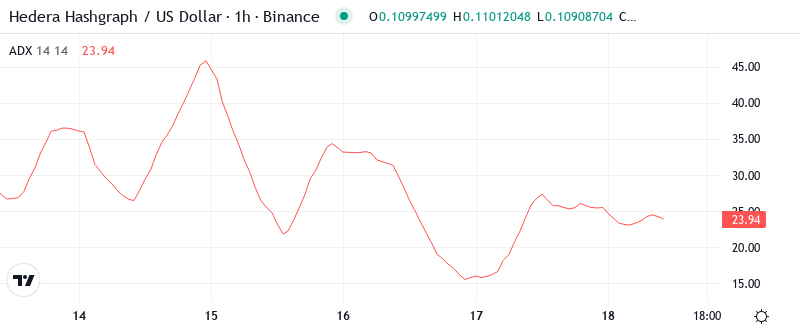
At the level of 29.60, the ADX entry indicates that the trend is gaining power after weeks of directionless chop below 25. The indicator’s surge from 18 to nearly 30 in just five trading days marks the sharpest acceleration since October’s rally phase. Basically, being in this zone means we’re transitioning from range-bound conditions where mean reversion dominated to a trending environment where momentum strategies typically outperform. Looking at historical patterns, ADX readings above 25 while price sits at multi-month lows have preceded HBAR’s most explosive rallies. The November setup saw similar ADX expansion from oversold conditions before price ripped 35% in eight days. Therefore, day traders should adjust their strategies to this shift – tight stops below $0.107 support with targets at resistance zones rather than trying to fade moves in either direction.
50-Day EMA at $0.147 Becomes Distant Target After Three-Month Decline
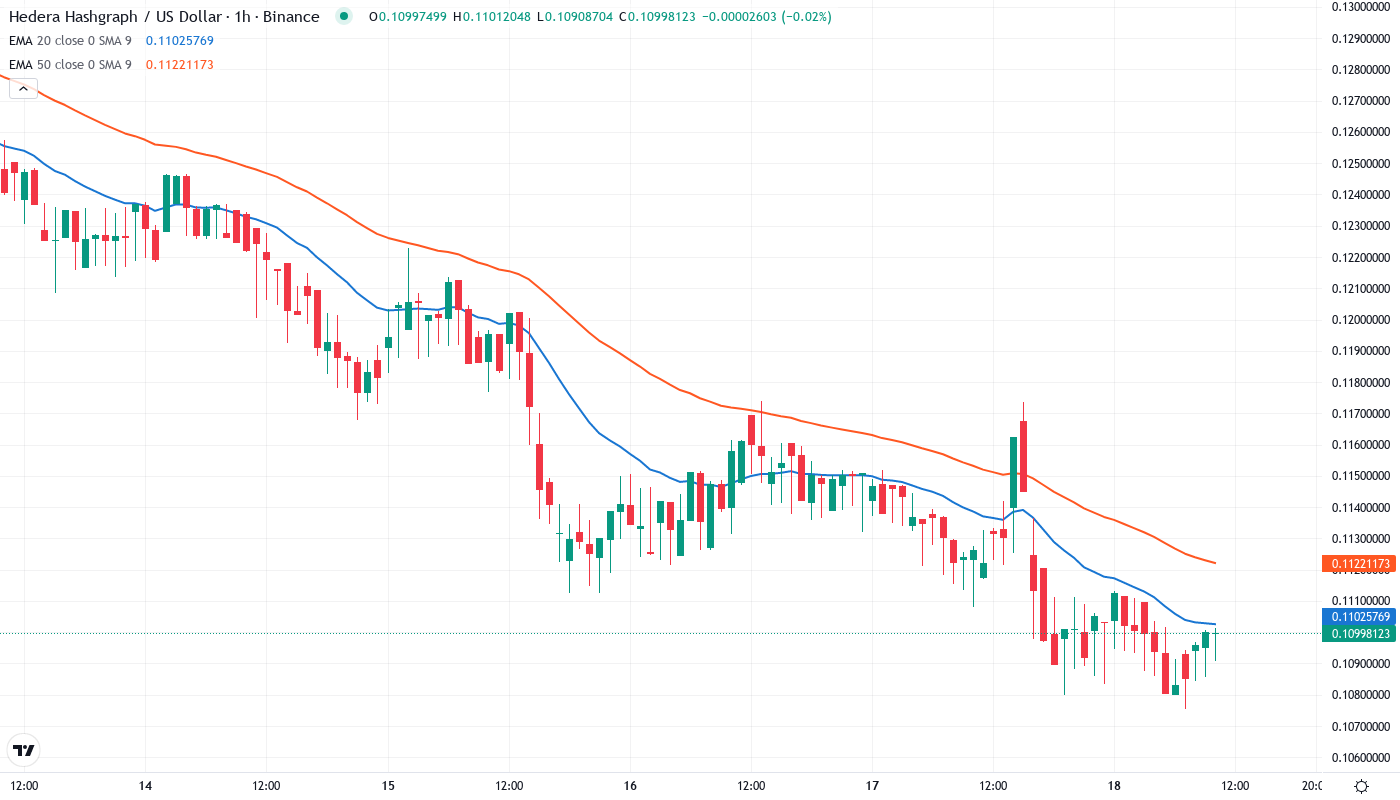
Price action remains deeply bearish through the EMA ribbons, with HBAR trading below every major moving average. The immediate concern sits with the 10-day EMA at $0.119 and 20-day at $0.128 – both rejected advances multiple times during December’s decline. More critically, the 50-day EMA at $0.147 now sits 35% above current price, representing the widest gap since the 2022 bear market bottom. Interestingly enough, this week’s CME announcement catalyzed the first meaningful attempt to reclaim short-term averages since November. The 10-day EMA that capped rallies throughout December now represents the first major test for bulls at $0.119. Should price convincingly close above this level, it would mark the initial step in repairing the severely damaged technical structure – though the 20-day at $0.128 looms as an even more formidable barrier given its role as resistance during the past month’s decline.
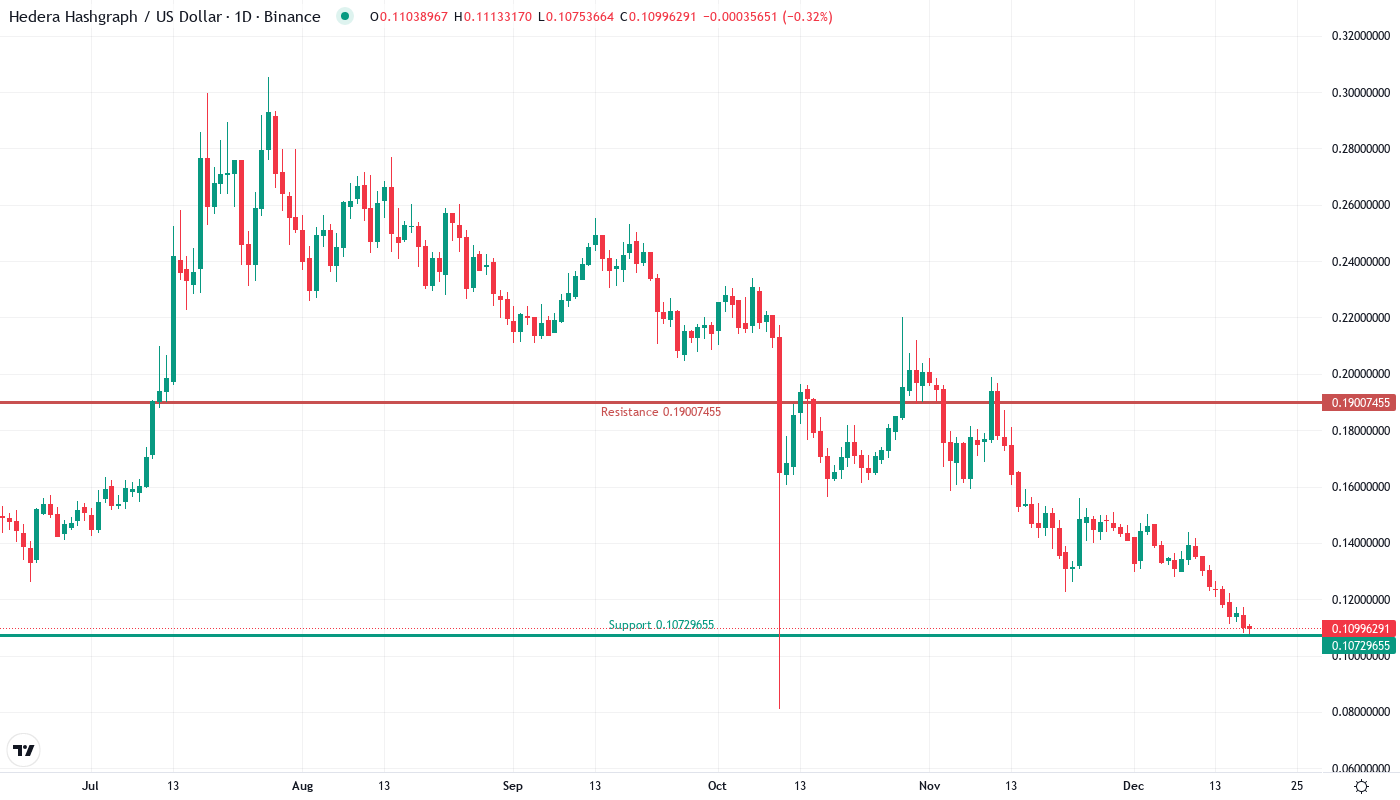
$0.107 Support Holds After Six Tests While Resistance Stacks at $0.119–$0.128
The support structure proved more resilient than expected this week, with $0.107 absorbing six separate tests over ten trading days before finally producing yesterday’s bounce. This level gains additional significance as it matches both the June 2023 low and the .786 Fibonacci retracement of the entire 2023–2024 rally. Volume surged 185% above average on the bounce, suggesting accumulation rather than short covering.
Above current price, resistance clusters densely between $0.119 and $0.128 where the 10-day and 20-day EMAs converge with December’s breakdown point. The monthly pivot at $0.155 represents more distant resistance, requiring a 42% rally to reach – though stranger things have happened when institutional validation meets oversold conditions in crypto markets.
This configuration creates an asymmetric risk-reward setup. The proximity to major support at $0.107 offers a clear stop-loss level just 3% below, while the first resistance target at $0.119 provides a 9% upside. More ambitious targets at the 20-day EMA ($0.128) and 50-day ($0.147) offer 17% and 35% potential gains respectively – attractive ratios for traders willing to bet on CME’s endorsement attracting fresh institutional flows.
Bulls Require Decisive Close Above $0.119 to Confirm Trend Reversal
Bulls must secure a daily close above $0.119 that conquers the 10-day EMA and confirms the reversal attempt. The combination of CME validation, SaucerSwap’s platform redesign, and deeply oversold conditions provides fundamental catalysts, but price needs to prove demand exists above immediate resistance. A successful break targets $0.128 next, where the 20-day EMA waits. The bearish scenario unfolds if HBAR fails to hold $0.107 on any retest, particularly on elevated volume. Loss of this critical support that held six times would likely trigger stop-loss cascades targeting $0.095 and potentially $0.085 – levels not seen since early 2023. Such a breakdown would trap recent dip buyers and suggest institutional interest remains insufficient to reverse the prevailing downtrend. Given the technical setup and fundamental developments, the most probable near-term path sees HBAR consolidating between $0.107 and $0.119 while building energy for a more decisive move. The oversold bounce needs time to reset momentum indicators before attempting significant resistance levels, making patience the optimal strategy for position traders while day traders can play the range with tight risk management.