Stellar (XLM) Tests Critical Support as UBI Partnership Sparks Recovery Hope
Market Structure Shifts Higher
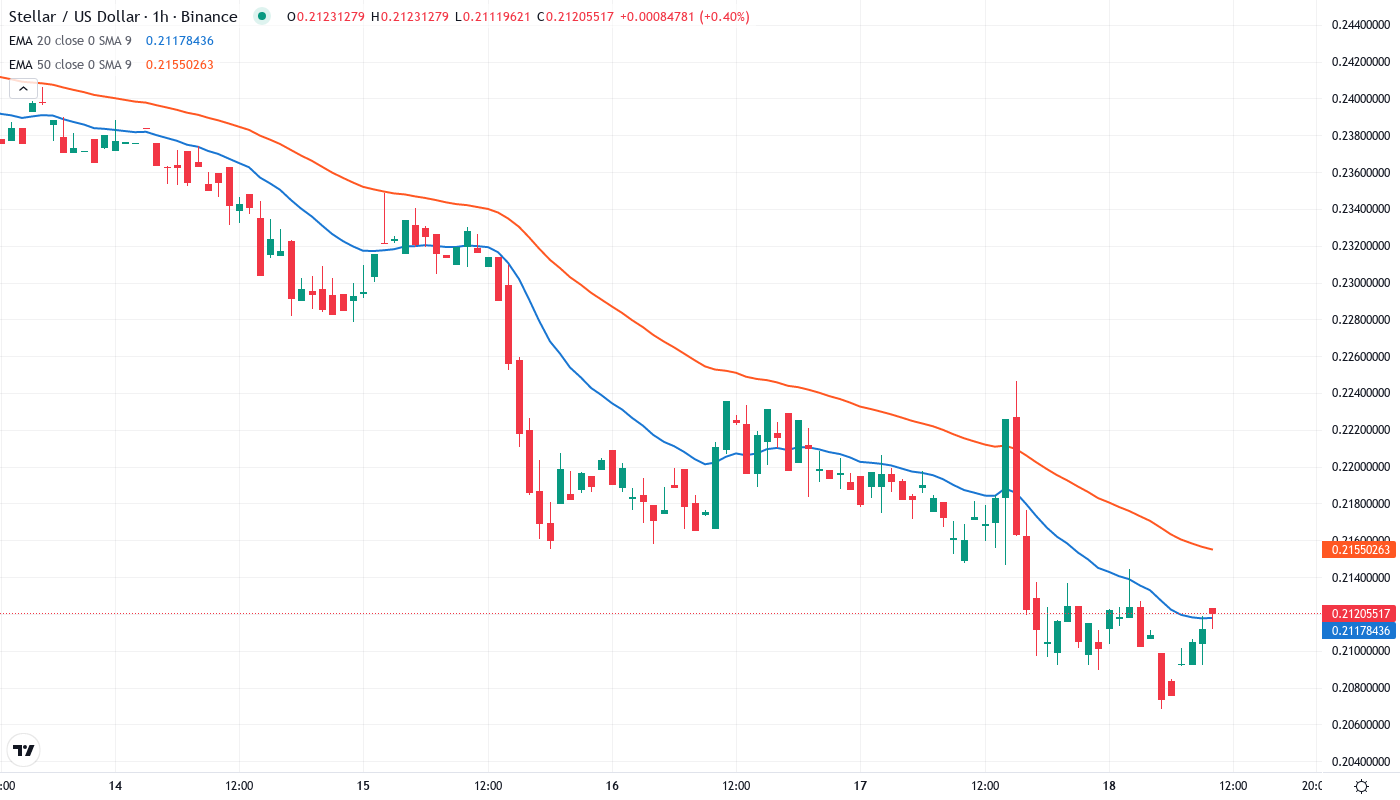
- XLM has rebounded from its $0.207 support level after the Marshall Islands announced plans to implement a national Universal Basic Income (UBI) using the Stellar blockchain.
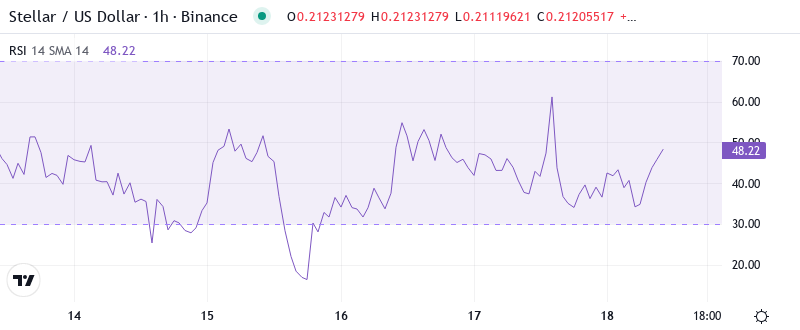
- The RSI has reset to neutral territory at 31.34 after the December oversold crash.
- To confirm a trend reversal, the price must break the $0.244 resistance area.
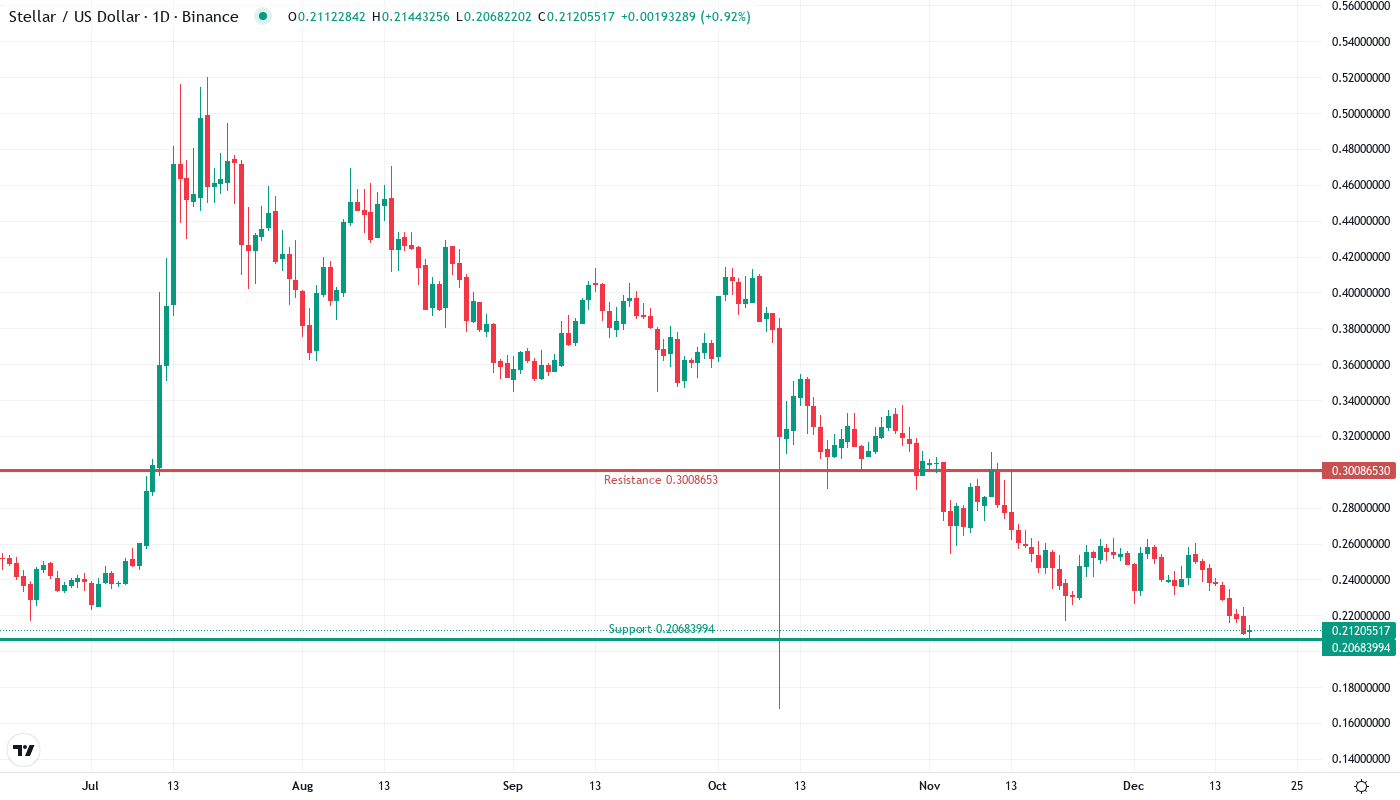
Stellar (XLM) tried to recover from its lowest point in December and rose by 2.4% last week to trade at $0.211 after testing key support at $0.207. The news came shortly after the Marshall Islands debut of the world’s first blockchain-based Universal Basic Income program on the Stellar network, with Lomalo delivering stablecoins between distant islands. The question for merchants on the trading floor remains the following: if the basic engine can accelerate, will it be enough to push XLM out of a downtrend that continues to plunge by 50.7% from the highs of the year?
| Metric | Value |
|---|---|
| Asset | STELLAR (XLM) |
| Current Price | $0.21 |
| Weekly Performance | -15.65% |
| Monthly Performance | -14.51% |
| RSI (Relative Strength Index) | 31.3 |
| ADX (Average Directional Index) | 32.2 |
| MACD (MACD Level) | -0.01 |
| CCI (Commodity Channel Index, 20-period) | -185.51 |
RSI Climbs From Oversold Territory – Room for Recovery Rally
The daily stochastic has followed the RSI in turning higher. The net weekly new high-new low composite has likewise recovered, with last week’s final print rising to -41. This reading is above recent mid-January, early February, and early March lows, but still very negative and comparable to the August 2024 low. Stock in bearish category remains at 58.8% and continues to decline. For the third week, the 14-day ADX is still rising, adding another element of dislocation. The renewed uptrend is favored to reconnect bullish ADX divergence above 20 in the weeks ahead as forced sellers re-engage.
What is interesting to note is that RSI did not shoot through the roof upon the UBI news, rather it gradually kept climbing from 23 to its current level, indicative of measured accumulation and not spiking frenzy. So for swing traders, this controlled RSI rebound, coupled with the Marshall Islands news, forms an attractive risk-reward opportunity to long around these levels with quick stops just below the 0.207 floor.
ADX at 32.16 Signals Trend Strength Building After Months of Chop
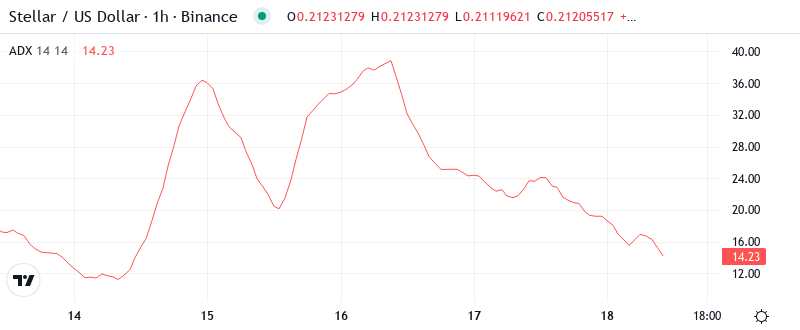
When trend following systems spin their wheels but price refuses to commit, you can wait for ADX to flash the “all-clear” sign before jumping back on the bandwagon. It provides a way for standing aside until a valid breakout occurs, rather than getting chopped apart by whipsawing price bars.
The ADX acceleration coming in the wake of the UBI news is no coincidence; fundamental catalysts tend to be the slingshot needed to release compressed markets from consolidation. Consequently, day trading strategies will have to be adjusted from a reliance on mean reversion tactics that capitalized on low-ADX chop to trend-following methodologies that garner directional momentum. With ADX set to validate increasingly solid trend dynamics, count on expanding volatility and greater daily amplitude.
20-Day EMA at $0.236 Becomes First Major Resistance Target
The 10-day EMA recently crossed back below the 20-day EMA, while the RSI and composite index meander through their downtrend. Confluent support at the 100-day MA remains the crucial barrier – dips this level have yet to close above it on the daily chart. Price action through December and January has sculpted an ominous topping pattern consistent with a double-top.
Even with renewed strength, XLM will still need to overcome even more EMA resistance from $0.272 upward. Immediate support is razor-thin and spread between $0.228-0.232. This support provided a reaction window over the past week that resulted in a hammer candle forming on the 12th, but more importantly, without at least another bear trap, it’s unlikely price can flush any pent-up supply. Price will likely consolidate near recent levels if identified support is broken.
Resistance Stacks Between $0.236 and $0.260 While $0.207 Holds Firm
There are multiple resistance levels above the current price where buyers imposed these resistances. $0.236 is the first one that includes the 20-day EMA and December’s breakdown level. $0.244 to $0.260 represents the next one including the 50-day EMA, the 100-day EMA, and the quarter-dollar psychological level at $0.25 that blocked breakouts in the entire Q4.
Buyers will need enthusiastic volume to lift the price through $0.267, the prior Sept. lower high, then conquer the 4-hour 50 EMA at $0.275. With typical crypto volatility, a move beyond attracts a retest of the 4-hour 200 EMA around $0.30 and the February high near $0.35.
The market structure shows suggestive accumulation occurring above $0.207 as savvy long-haul investments lead likely rich with the hopes of UBI-based appropriation. In the event that solid support is found on a retest of this level, the current technical approach will encourage a grind back up to test recent highs. The Marshall Islands development furnishes the overarching story needed for bulls to make their stand.
UBI Catalyst Could Spark Recovery Above $0.244 Resistance Cluster
For the trend change to solidify, XLM bulls will need to see a daily close above $0.244. This level not only coincides with the 50-day EMA but it’s also within the previous support zone from late December which is likely to act as resistance on the way up. If bulls can clear that level, the 20-EMA is right at the $0.260 level, which would likely act as the next major resistance point.
If buyers do overcome soft resistance near $0.23, the early test would be the daily 50-and 100-MA at $0.255. A close above that level would further solidify the technical competitive landscape and would entice owners who missed the initial rally. Additionally, the almost certain spark of short covering could push price to the 200-MA and yearly high at $0.32.
Since an overbought reaction is likely as XLM tests the nearly 400% rally from October before breaking through it, the $0.275-0.325 area would be the subsequent target zone if bulls can overcome the current resistance block. The successful surge further into five-year highs continu8ing the previous uptrends in no dew.