Aptos Tests Critical Support as Stablecoin Flows Surge to $386M
Market Structure Shifts Lower
- APT plunges 89% from yearly highs, now defending $1.52 support
- $386M stablecoin inflows signal institutional accumulation at lows
- RSI drops to oversold territory for first time since market-wide washout
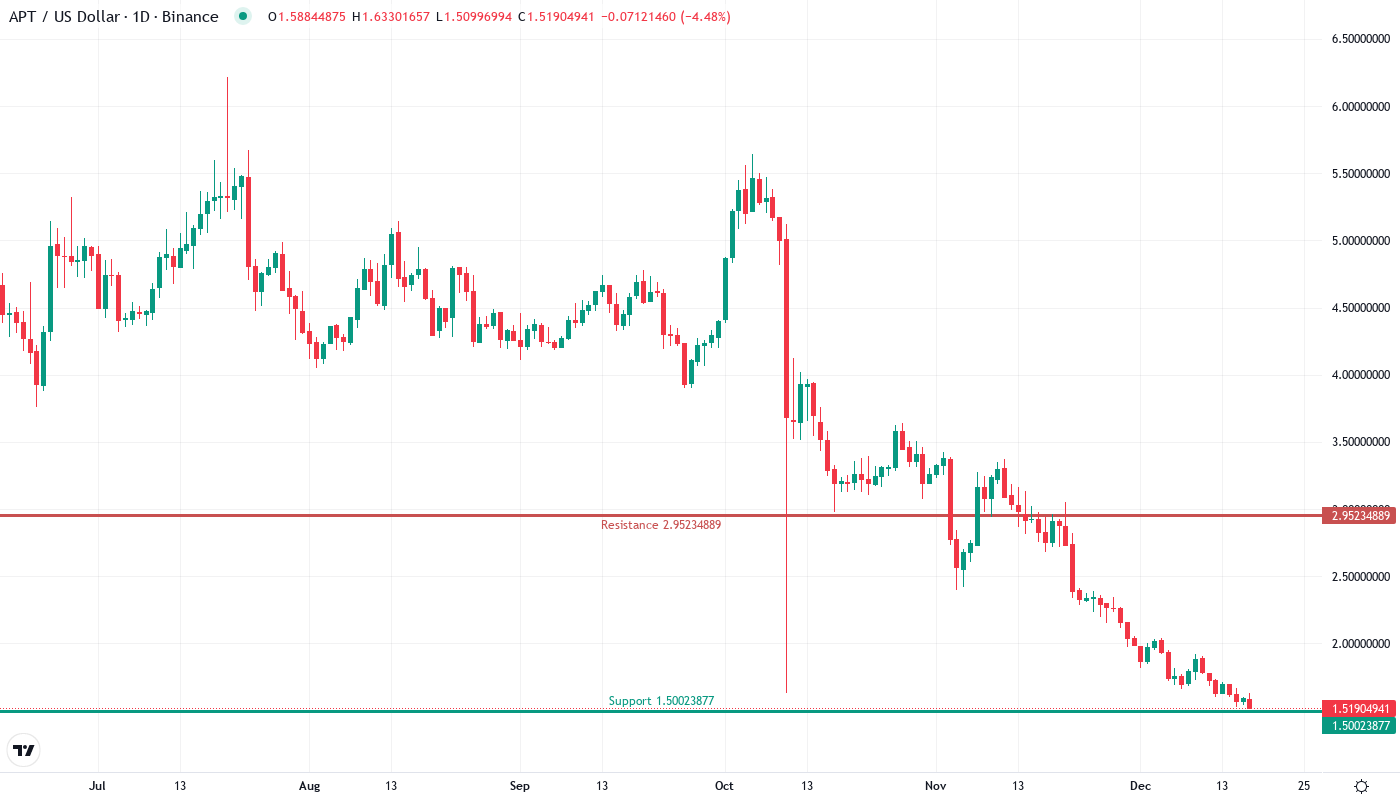
Aptos has endured a devastating drop from its yearly peak of $19.92, shedding 89.1% to trade at $1.52 as sellers dominated throughout 2024. The token lost 46.4% in just the past month alone, erasing nearly half its value while testing a critical support zone that has held since the August market-wide capitulation. Despite the brutal price action, a surge of $386 million in stablecoin inflows hints at smart money accumulating near multi-month lows. The main question for traders is: can this influx of fresh capital defend the $1.50 psychological level, or will bears push through to new yearly lows?
| Metric | Value |
|---|---|
| Asset | APTOS (APT) |
| Current Price | $1.52 |
| Weekly Performance | -19.63% |
| Monthly Performance | -46.39% |
| RSI (Relative Strength Index) | 28.1 |
| ADX (Average Directional Index) | 51.5 |
| MACD (MACD Level) | -0.25 |
| CCI (Commodity Channel Index, 20-period) | -118.77 |
RSI Hits Oversold at 28.05 – Matches August Capitulation Levels
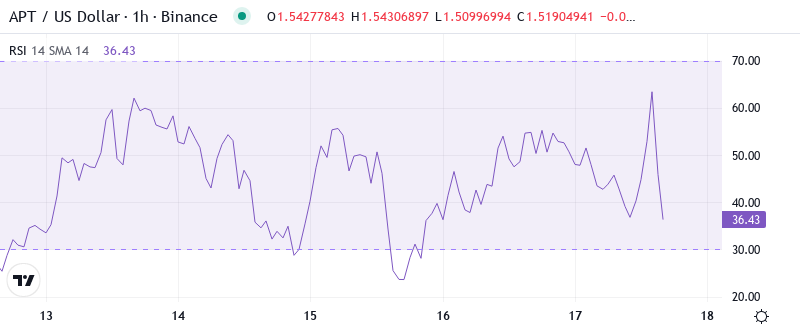
Reading the oscillator at 28.05 on the daily timeframe, APT has entered oversold territory for the first time since the August market flush. This marks a significant shift from the neutral 45-50 range where RSI consolidated during the October-November period. Historically, APT’s ventures below RSI 30 have preceded sharp relief rallies – the August dip to similar levels sparked a 65% bounce within two weeks.
What’s revealing is how the weekly RSI at 30.37 confirms the oversold condition across multiple timeframes, suggesting this isn’t just a short-term dip but genuine exhaustion of selling pressure. So for swing traders, this oversold confluence combined with the $386M stablecoin injection creates a high-probability bounce setup, though any rally faces significant overhead resistance from trapped longs.
ADX Spikes to 51.55 – Extreme Trend Strength Signals Potential Exhaustion
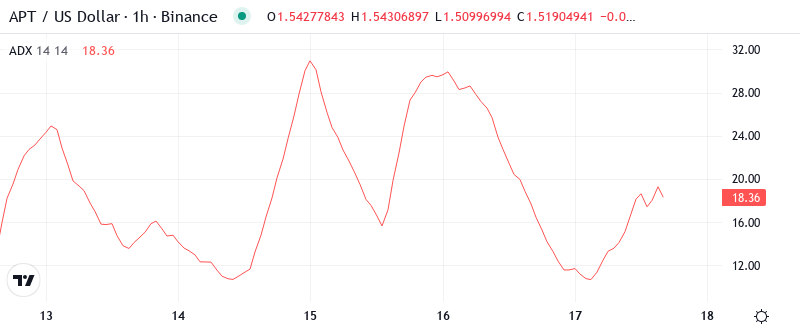
Momentum indicators flash extreme readings with ADX climbing to 51.55, marking one of the strongest directional moves in APT’s history. At this level, the trend has moved from steady decline into blow-off territory. Basically, when ADX exceeds 50, it often signals that the prevailing trend – in this case bearish – is approaching exhaustion as sellers run out of ammunition.
To clarify, while the extreme ADX confirms devastating selling pressure, it also suggests we’re nearing a turning point. The combination of oversold RSI and overextended ADX historically precedes violent snapback rallies. Therefore, contrarian traders should prepare for a potential reversal, especially with fresh stablecoin liquidity entering the ecosystem through the recent $386M inflows.
Price Trapped Below Entire EMA Ribbon Since December Collapse
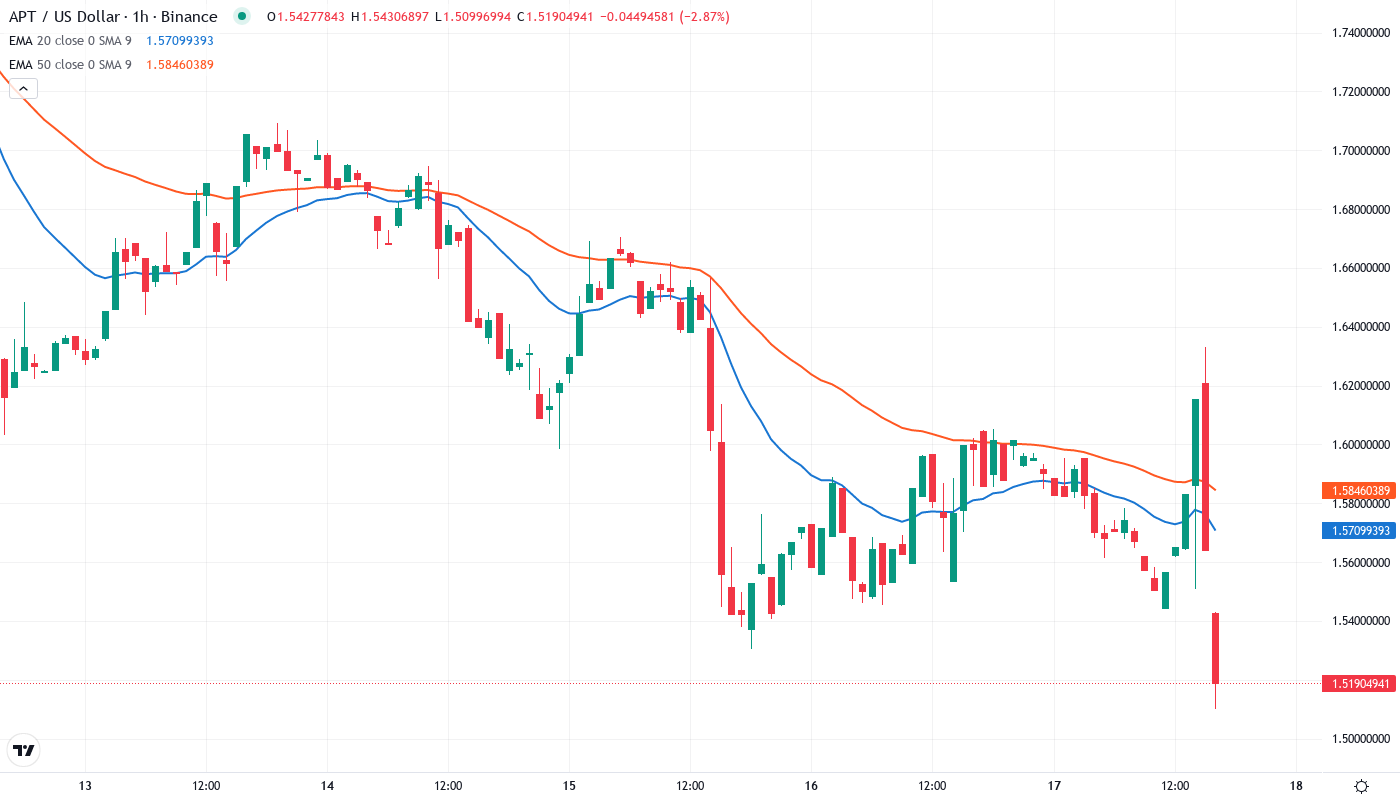
Looking at the moving average structure reveals the depth of APT’s decline. Price trades below every significant EMA – the 10-day at $1.67, 20-day at $1.84, and crucially the 50-day at $2.38. This complete breakdown of the EMA ribbon occurred during December’s cascade lower, transforming each average from support to resistance.
Most significant is the 200-week EMA sitting at $3.87, now 155% above current price. The monthly 50-EMA at $4.72 represents even more distant overhead supply. For bulls to shift the narrative, they must first reclaim the 10-day EMA at $1.67 – until then, every bounce faces a wall of resistance from underwater positions. The Goblin Finance $1M funding round signals developer confidence, but price needs to confirm with a decisive EMA reclaim.
$1.50 Psychological Support Faces Sixth Test as Bulls Make Stand
Resistance stacks heavy between current levels and any meaningful recovery. The immediate ceiling sits at $1.67 (10-day EMA), followed by the 20-day at $1.84. Above that, the monthly pivot at $2.46 coincides with the 50-day EMA at $2.38, creating a formidable resistance cluster. December’s breakdown point at $3.05 marks the next major hurdle.
Bulls defend multiple support layers centered on the $1.50 psychological level, which has repelled six separate attacks since June. The August low at $1.48 provides the final backstop before uncharted territory. Weekly support emerges at the $1.01 level, though reaching it would constitute complete capitulation.
This configuration resembles a compressed spring, with APT coiled between $1.50 support and $1.67 resistance. The $386M stablecoin surge and Goblin Finance investment suggest institutional players see value at these levels, but price must hold $1.50 to validate their conviction.
Bulls Need Daily Close Above $1.67 to Spark Relief Rally
Should price reclaim the 10-day EMA at $1.67 with conviction, the technical setup favors a relief rally toward $2.38 (50-day EMA). The oversold bounce could extend to $3.05 if stablecoin flows continue supporting the ecosystem. Fresh DeFi development through Goblin’s yield layer provides fundamental catalysts for recovery.
The setup fails if APT loses $1.50 on a daily close, likely triggering stop-loss cascades toward the $1.01 weekly support. Such a breakdown would trap recent bottom-fishers and potentially spark capitulation toward uncharted lows below $1.00. Volume below average suggests many participants remain sidelined.
Given the extreme oversold readings and record stablecoin inflows, the most probable near-term path sees APT bouncing between $1.50-$1.85 as bottom-formation continues. The confluence of technical exhaustion signals and fundamental developments suggests accumulation phase rather than further waterfall declines.