Polkadot Reclaims $2 After Crushing 78% Decline – ETF Inclusion Sparks Recovery

Market Pulse
- Polkadot tests critical $2 psychological level after devastating year-long descent from $11 highs
- Bitwise ETF inclusion provides first institutional catalyst since summer 2023
- ADX at 36 signals genuine trend strength building from compressed base
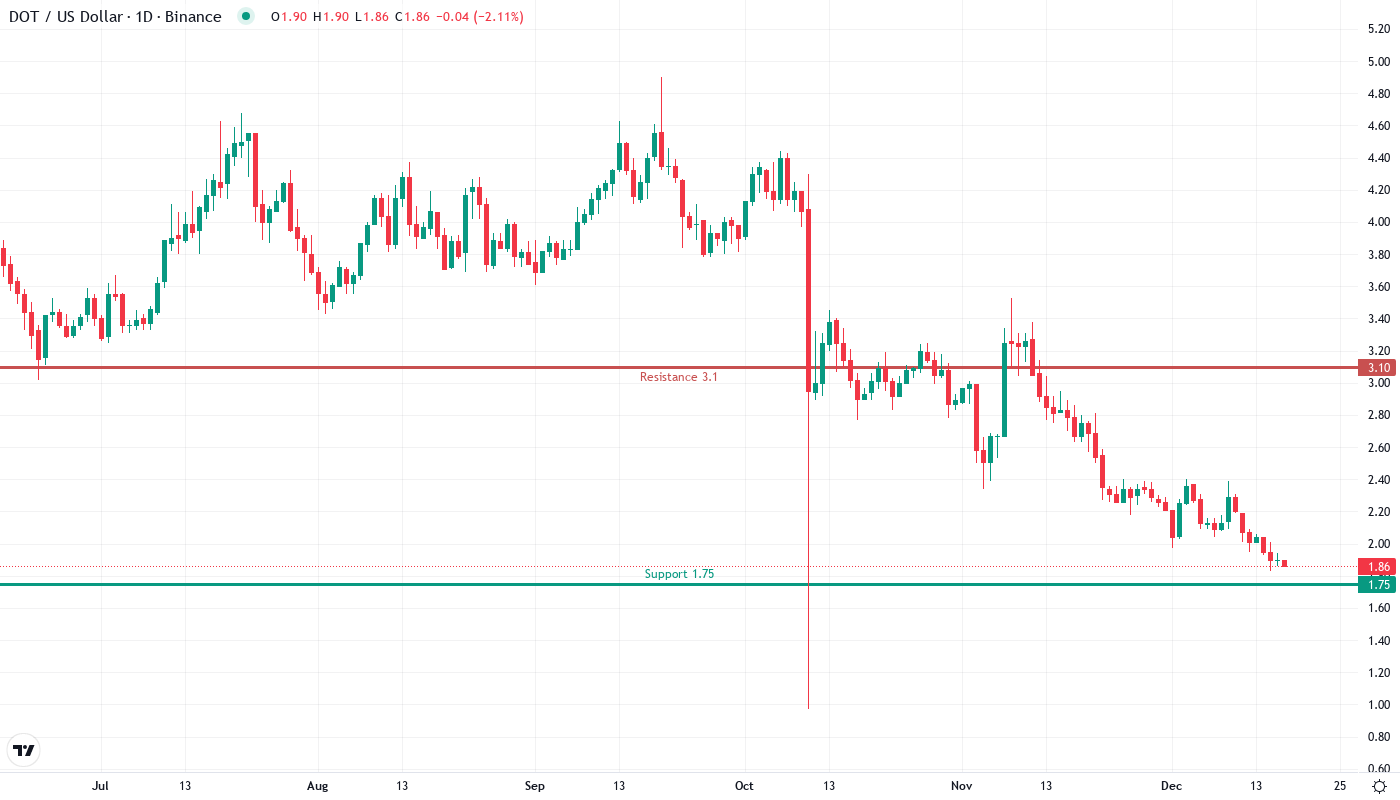
Polkadot has darted back above $2 for the first time in weeks, climbing 5.3% to $2.10 as the Bitwise ETF announcement injected fresh institutional interest into the battered altcoin. The move comes after a devastating 78% yearly decline that saw DOT collapse from $11 highs to recent lows near $1.83, erasing nearly four-fifths of holder value. With USDC integration on the Polkadot network and growing ETF exposure, the main question for traders is: can this relief bounce transform into sustainable recovery, or will sellers emerge at overhead resistance?
| Metric | Value |
|---|---|
| Asset | POLKADOT (DOT) |
| Current Price | $1.87 |
| Weekly Performance | -18.34% |
| Monthly Performance | -32.97% |
| RSI (Relative Strength Index) | 32.4 |
| ADX (Average Directional Index) | 36.1 |
| MACD (MACD Level) | -0.17 |
| CCI (Commodity Channel Index, 20-period) | -143.77 |
Momentum Exhaustion Signals Capitulation Phase Complete
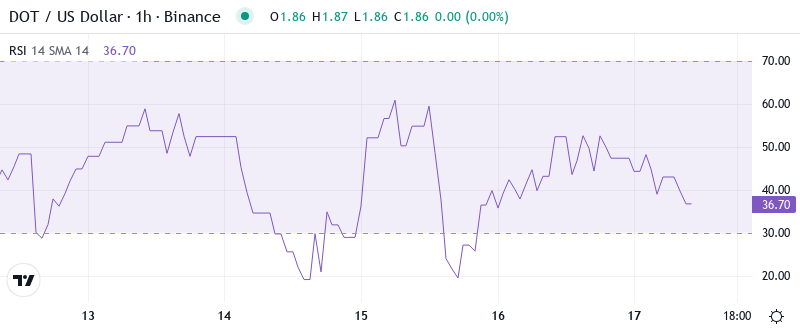
RSI sits at 32.36 on the daily timeframe, marking the second-lowest reading this year and matching levels last seen during August’s market-wide washout. The oscillator has spent three consecutive weeks below 40, suggesting seller exhaustion after the prolonged downtrend pushed momentum indicators into deeply oversold territory.
What’s revealing is how RSI behaved during the recent ETF-driven bounce – climbing from 28 to 32 represents meaningful improvement but still leaves substantial room before reaching neutral 50 levels. Basically, momentum has reset from extreme lows, giving bulls their first clean slate since summer to attempt building a sustainable recovery structure.
ADX at 36 Confirms Shift From Compression to Trending Market
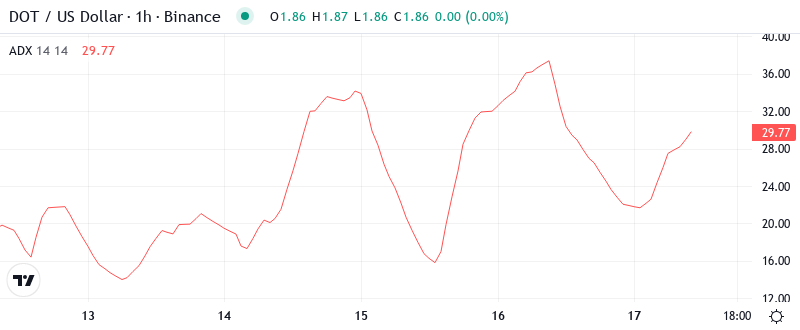
Trend strength reads decisively at 36.09, well above the 25 threshold that separates ranging markets from trending conditions. This marks the highest ADX reading since June’s collapse, indicating the current move carries genuine directional conviction rather than mere oversold bouncing.
More telling is the compression period that preceded this ADX surge – the indicator lingered below 20 for six weeks as price coiled between $1.83 and $2.20. To clarify, markets typically see explosive moves following such extended compression phases, and with ADX now accelerating above 35, trend followers should prepare for sustained directional movement rather than quick reversals.
20-Day EMA at $2.12 Becomes First Major Resistance Test
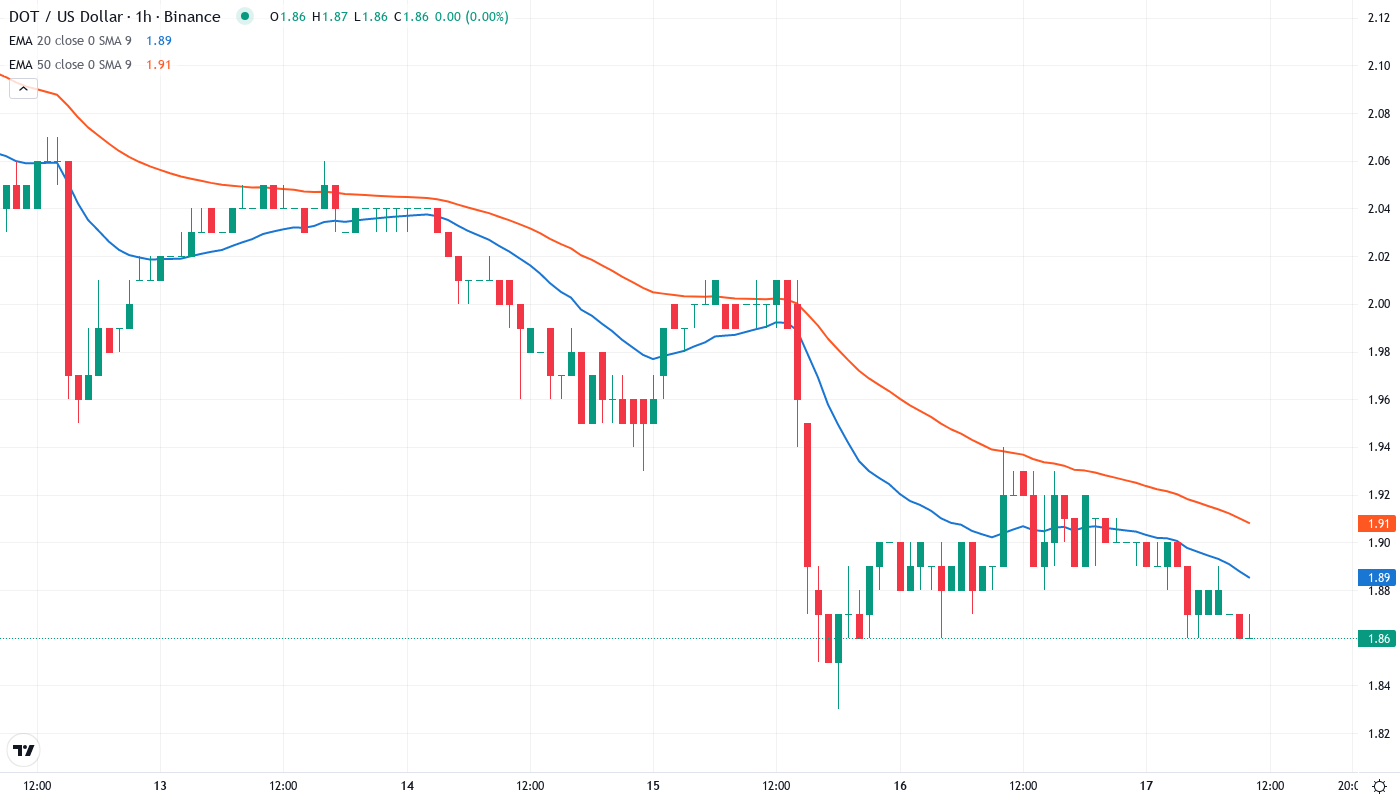
Price action reveals a clear battle at the moving average confluence zone. DOT currently trades at $2.10, just below the 20-day EMA at $2.12, while the 50-day EMA looms overhead at $2.47. The 10-day EMA at $2.00 flipped from resistance to support during yesterday’s ETF-driven surge, providing the first bullish structural shift in months.
Looking at the broader EMA architecture, the 100-day and 200-day EMAs rest far above at $2.89 and $3.41 respectively, creating a stacked resistance structure that will challenge any recovery attempt. It is worth mentioning that DOT hasn’t traded above its 50-day EMA since early November – reclaiming and holding above $2.47 would mark a significant trend change and likely trigger further short covering.
Resistance Clusters Between $2.24 and $2.64 as Bulls Face Overhead Supply
Above current levels, sellers have stacked multiple resistance zones that coincide with prior support failures. The immediate hurdle sits at $2.24, where December’s breakdown point meets the monthly pivot R1, creating a confluence that rejected price twice in the past two weeks despite positive USDC integration news.
Bulls now guard the $1.87 level as critical support, representing both the psychological round number and the zone where institutional accumulation emerged following the ETF announcement. This level absorbed six tests during December’s compression phase and continues to attract buyers on any approach.
Market structure signals cautious optimism as long as bulls defend $1.87 on any retracement. The weekly close above $2 marks the first positive structural development since October, though bears still control the broader trend until price reclaims and holds above the 50-day EMA at $2.47.
Bulls Need Sustained Close Above $2.47 to Confirm Trend Reversal
Should DOT secure a daily close above the 50-day EMA at $2.47, the technical picture shifts dramatically bullish with measured move targets pointing toward $2.85-$2.95. The combination of ETF flows and USDC utility provides fundamental catalysts to sustain such a move.
Bears regain control if price hard rejects at $2.24 and drops below $1.87 on volume – this would trap recent ETF buyers and likely trigger cascading stops toward $1.70. Given the extended oversold conditions, such a breakdown would signal complete capitulation rather than healthy retracement.
Taking into account the oversold bounce, improving momentum, and institutional interest via ETF inclusion, the most probable near-term path sees DOT consolidating between $1.87-$2.24 while building energy for an eventual assault on the 50-day EMA. The key for traders: watch how price behaves at $2.12 resistance over the next 48 hours.