Solana Tests Critical Support After 7% Weekly Drop as Network Resilience Battles Market Headwinds
Market Structure Shifts Lower
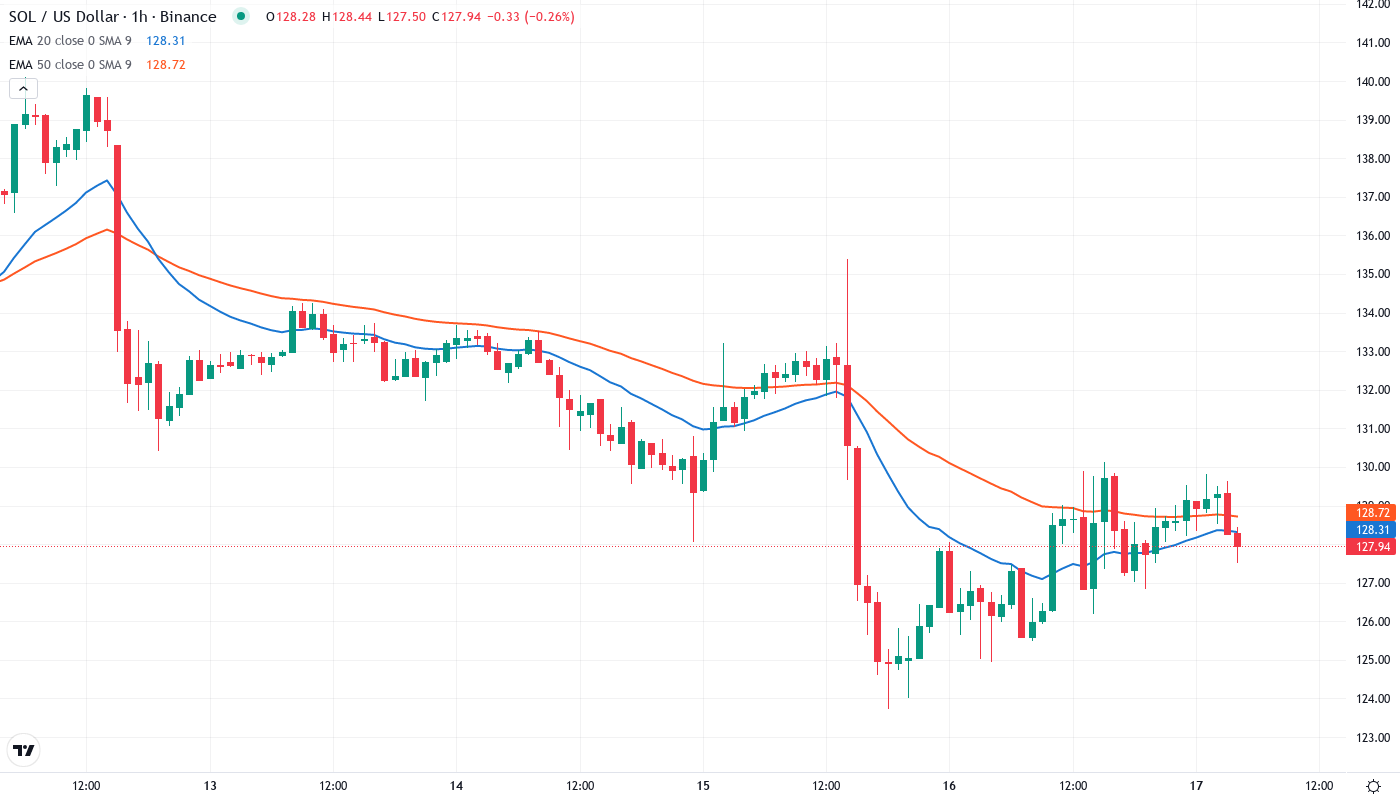
- SOL drops 7.3% weekly to $127.77 despite successful defense against massive DDoS attack
- Institutional products launch in Brazil while price tests key technical support zones
- ADX signals trend exhaustion at 26.77 as momentum indicators reset from oversold territory
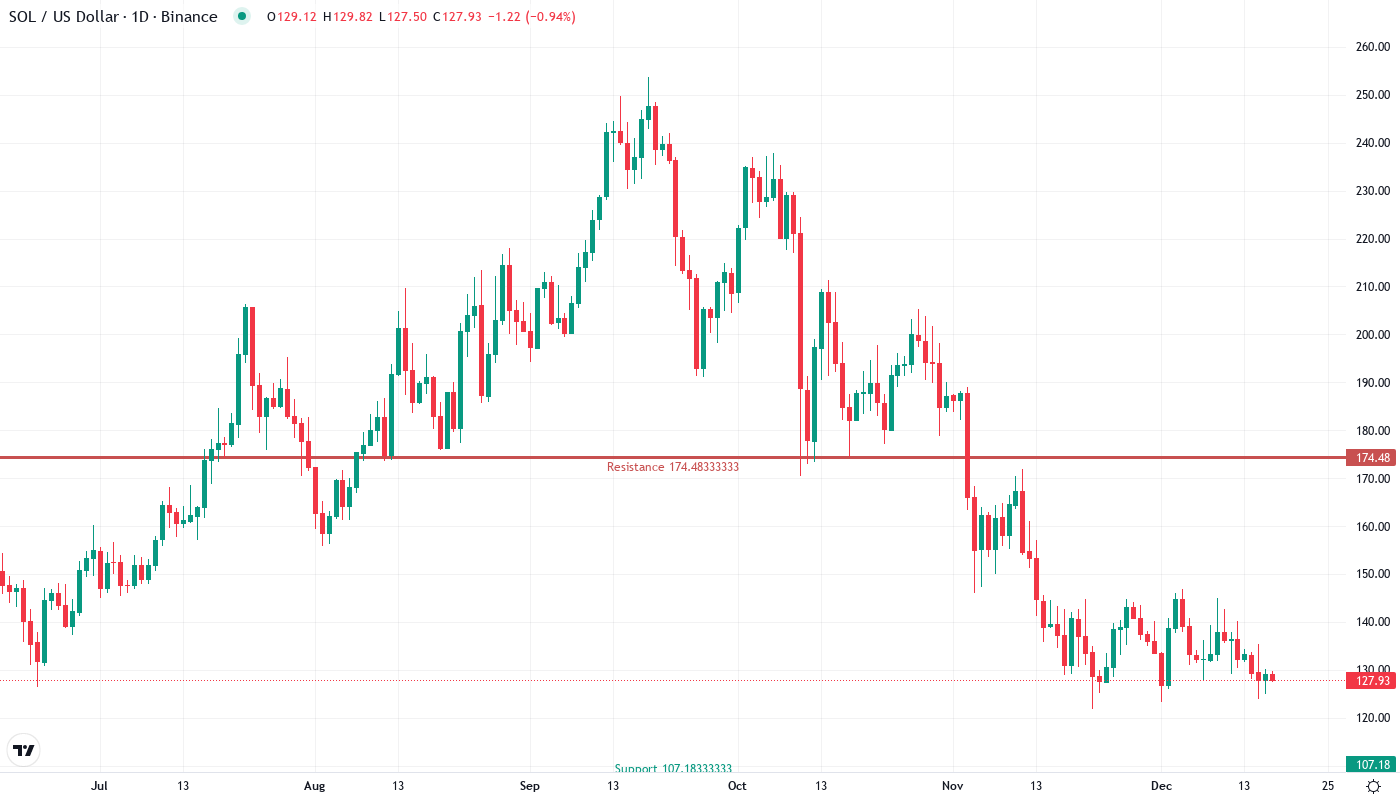
Solana’s price action tells a tale of two narratives this week – technological triumph meeting market reality. The network successfully repelled a massive distributed denial-of-service attack without any performance degradation, yet SOL still shed 7.3% over the past seven days to land at $127.77. This disconnect between fundamental strength and price weakness reflects broader crypto market dynamics, where even positive developments struggle against macro headwinds. The main question for traders is: can SOL’s proven network resilience and expanding institutional access through new Brazilian ETPs provide enough support at current levels, or will technical pressures drive further downside?
| Metric | Value |
|---|---|
| Asset | SOLANA (SOL) |
| Current Price | $127.77 |
| Weekly Performance | -7.29% |
| Monthly Performance | -6.87% |
| RSI (Relative Strength Index) | 39.3 |
| ADX (Average Directional Index) | 26.8 |
| MACD (MACD Level) | -4.47 |
| CCI (Commodity Channel Index, 20-period) | -119.85 |
RSI at 39.27 Signals First Oversold Touch Since November Washout
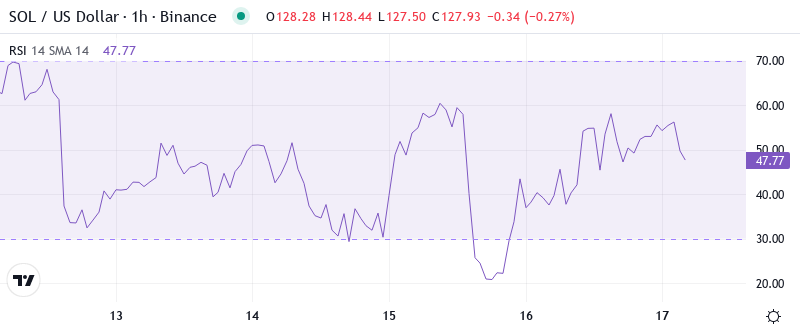
Reading the oscillator at 39.27, traders see momentum has swung into oversold territory for the first time since November’s broader market correction. This level typically marks a zone where selling pressure exhausts itself, though it doesn’t guarantee an immediate bounce. The successful DDoS defense demonstrated Solana’s technical maturity, yet sellers remained in control throughout the week, pushing RSI below the neutral 50 line and into capitulation territory.
What’s revealing is how RSI behaved during the network attack – it barely budged from already depressed levels, suggesting the market had already priced in significant pessimism. Similar oversold readings in September preceded a 35% relief rally within two weeks, though current market conditions differ with Bitcoin’s dominance reasserting itself. So for swing traders, this oversold RSI creates a potential opportunity for mean reversion plays, but only if SOL can hold above the $120 psychological support that aligns with monthly lows at $121.77.
ADX at 26.77 Shows Trend Momentum Fading After December Decline
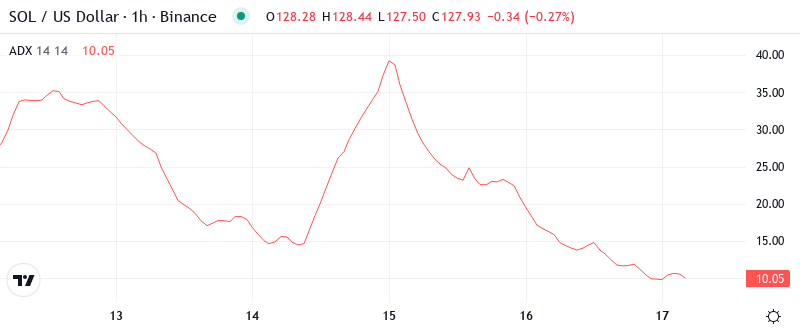
At the level of 26.77, the ADX entry indicates that the downtrend is losing steam but hasn’t fully exhausted yet. Basically, we’re transitioning from a trending market back toward consolidation, which typically happens after sharp directional moves like SOL’s 47% three-month decline. The fading trend strength coincides with major positive catalysts – Visa’s USDC settlement integration and Invesco/Galaxy’s new ETP launch – suggesting sellers may be running out of ammunition.
Trend followers should note this ADX configuration often precedes sideways chop rather than immediate reversals. Since ADX peaked above 40 during December’s washout and has steadily declined, the market appears ready for a breather. Therefore, range traders might find better opportunities than trend followers in the near term, especially with support and resistance levels becoming more defined around current prices.
20-Day EMA at $134.12 Caps Recovery Attempts as 50-Day Looms Above
Looking at the moving average structure, SOL faces a stacked resistance zone overhead. Price trades below the entire EMA ribbon, with the 10-day at $131.30, 20-day at $134.12, and the critical 50-day EMA at $140.14 all sloping downward. This bearish alignment hasn’t occurred since the November correction, and it’s particularly notable given the positive fundamental developments including the Brazil B3 exchange ETP launch.
The 50-day EMA rejection three weeks ago marked the start of this current leg lower, transforming what was support throughout October into formidable resistance. More concerning for bulls, the 100-day EMA at $147.15 and 200-day at $115.42 are converging, potentially setting up a death cross if current weakness persists. That former support at $140 now becomes the key level bulls need to reclaim to shift the technical structure back in their favor, especially with institutional access expanding through new investment products.
Resistance Stacks Between $135 and $148 While $120 Support Undergoes Sixth Test
Above current prices, sellers have fortified multiple resistance layers. The immediate ceiling sits at $131.30 (10-day EMA), followed by the psychological $135 level that coincides with the 20-day EMA at $134.12. Beyond that, the monthly pivot at $148.13 aligns perfectly with the 100-day EMA at $147.15, creating a confluence zone that would require significant buying pressure to overcome – perhaps from the new institutional flows via Invesco and Galaxy’s ETP.
Bulls defend the $120-122 support zone that’s been tested six times since June, with monthly lows at $121.77 providing the exact floor. This level gains additional significance from November’s consolidation pattern and represents the last major support before the 200-day EMA at $115.42. The repeated bounces from this zone, including during this week’s DDoS attack, demonstrate buyers’ commitment to defending this psychological round number.
Market structure suggests a compression pattern forming between $120 support and $135 resistance. This $15 range (roughly 12%) provides clear boundaries for traders while the market digests Visa’s Solana integration announcement and processes the implications of enhanced institutional access through multiple ETP launches. The tightening range typically resolves with a directional breakout once one side exhausts.
Bulls Need Decisive Close Above $135 to Confirm Technical Recovery
Should price reclaim the $135 level with conviction and hold above the 20-day EMA, bulls could target the $140-148 resistance cluster where the 50-day and 100-day EMAs converge. The expanding institutional infrastructure through Brazilian and European ETPs provides fundamental catalysts, but technical confirmation requires volume and daily closes above these key averages.
The bearish scenario triggers if $120 support fails after this sixth test, which would likely flush positions down to the 200-day EMA at $115.42 or even the yearly low near $80. Loss of this critical support would trap recent buyers who entered on positive Visa and ETP news, potentially accelerating downside through stop-loss cascades.
Given the fading ADX trend strength, oversold RSI conditions, and major support holding despite negative price action, the most probable near-term path sees SOL consolidating between $120-135 while the market evaluates whether institutional adoption can offset broader crypto market weakness. The successful DDoS defense proves network stability, but price stability requires either Bitcoin’s cooperation or overwhelming institutional demand to break the current technical malaise.