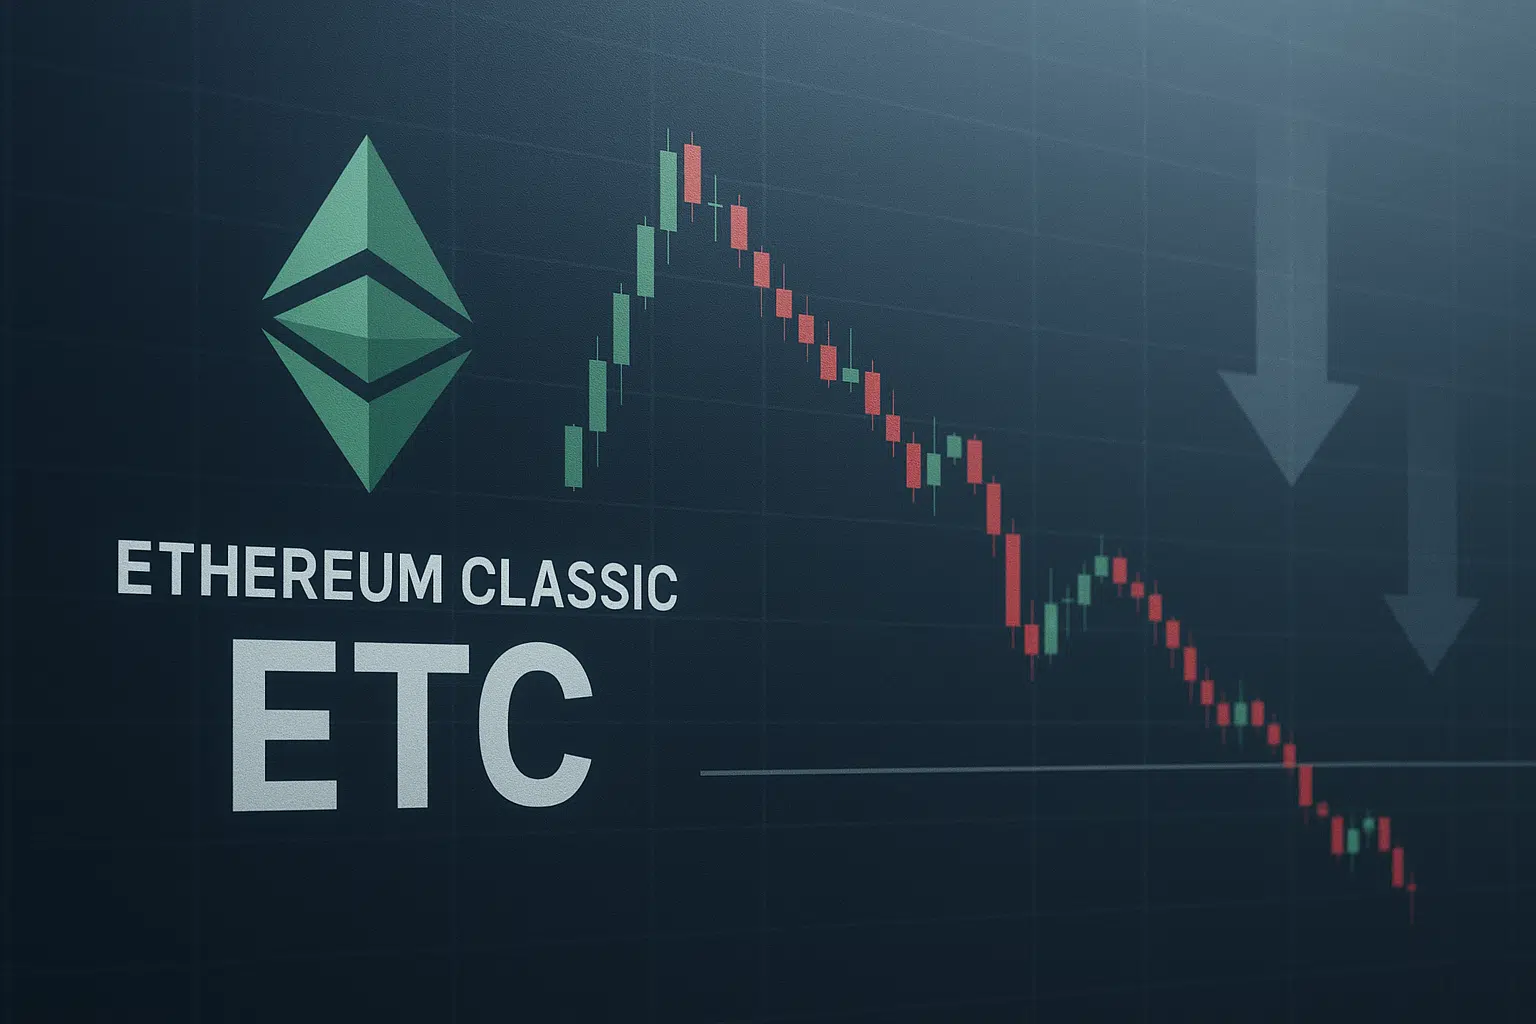
Ethereum Classic Tests Critical Support as Sellers Dominate December Trading
Market Pulse
- ETC dropped 17.2% in December, erasing gains from the November surge
- Six-time tested support at $12.04 emerges as make-or-break level for bulls
- ADX climbs past 24, signaling shift from choppy to trending conditions
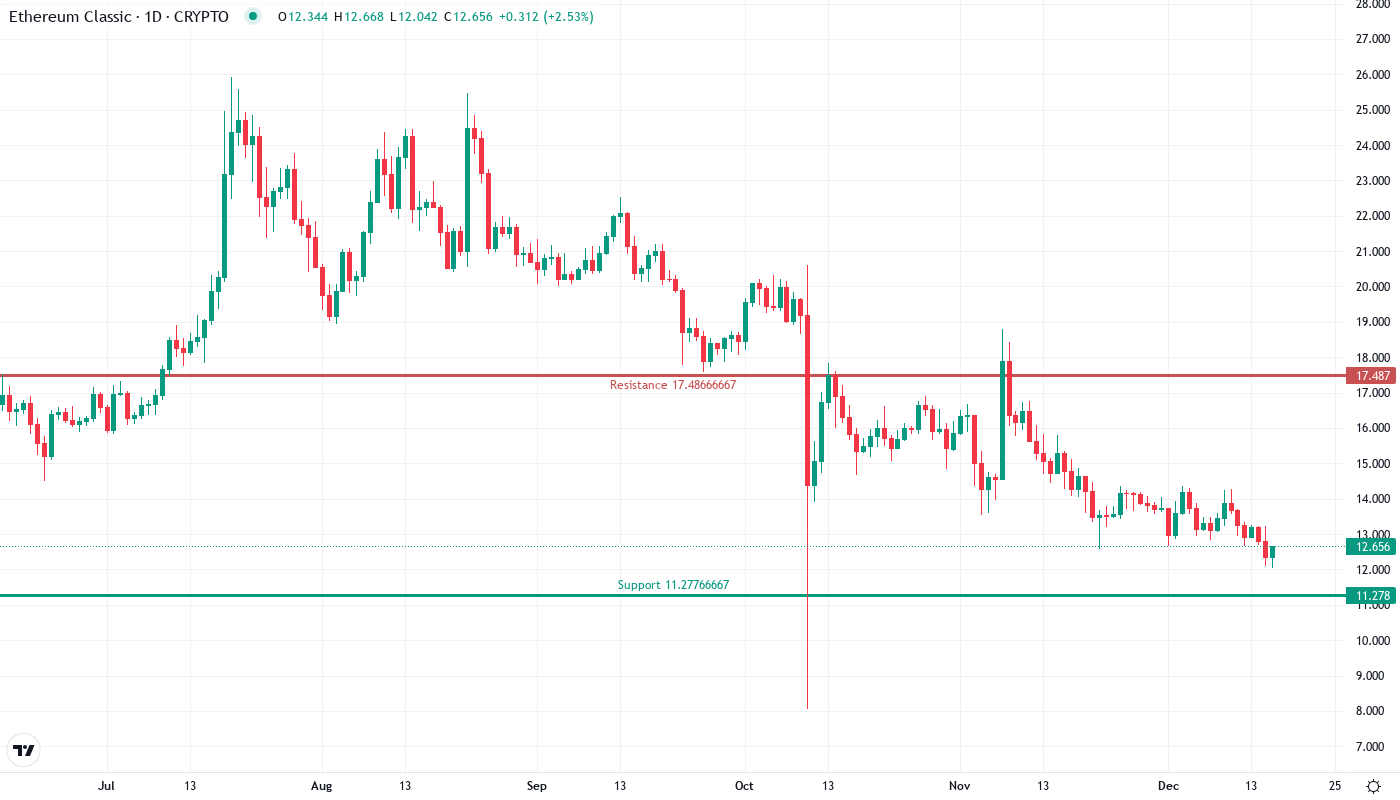
Ethereum Classic tumbled from $15.12 to $12.66 this month, a devastating 17.2% drop that wiped out November’s recovery attempt and pushed the altcoin back toward its December lows. The selloff accelerated after Vitalik Buterin’s warnings about validator trust sparked broader concerns across proof-of-work chains, while Kaspa’s record throughput claims drew unfavorable comparisons to ETC’s transaction processing capabilities. The main question for traders is: can bulls defend the crucial $12.04 support that has held six times since June, or will this level finally crack under sustained selling pressure?
| Metric | Value |
|---|---|
| Asset | ETHEREUM CLASSIC (ETC) |
| Current Price | $12.66 |
| Weekly Performance | -5.86% |
| Monthly Performance | -17.20% |
| RSI (Relative Strength Index) | 40.2 |
| ADX (Average Directional Index) | 24.1 |
| MACD (MACD Level) | -0.46 |
| CCI (Commodity Channel Index, 20-period) | -167.30 |
RSI Hovers at 43 – Neither Oversold Nor Bullish
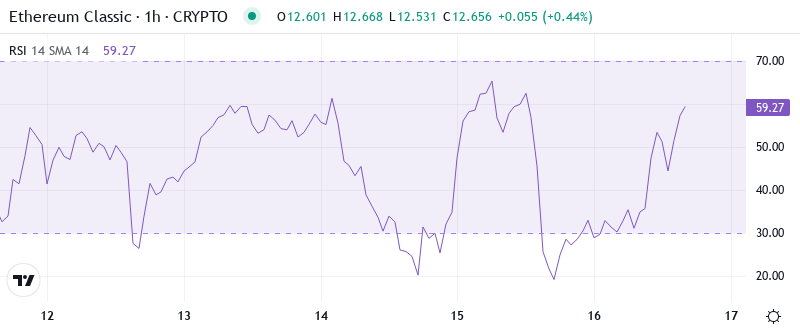
Reading the oscillator at 43.00 on the daily timeframe, traders see a market that’s tilted bearish but not yet capitulated. This balanced-yet-weak momentum differs sharply from November’s surge when RSI climbed above 65, and it’s nowhere near the extreme oversold readings below 30 that marked genuine bottoms in August and October. Basically, the current setup suggests sellers control the narrative without pushing hard enough to trigger oversold bounces.
What stands out here is the steady grind lower without momentum extremes – a pattern that often precedes deeper corrections rather than immediate reversals. So for swing traders, this neutral-to-bearish RSI configuration means waiting for either a dip below 30 for oversold entries or a recovery above 50 to confirm any potential trend reversal.
Trend Strength Builds as ADX Climbs Through 24
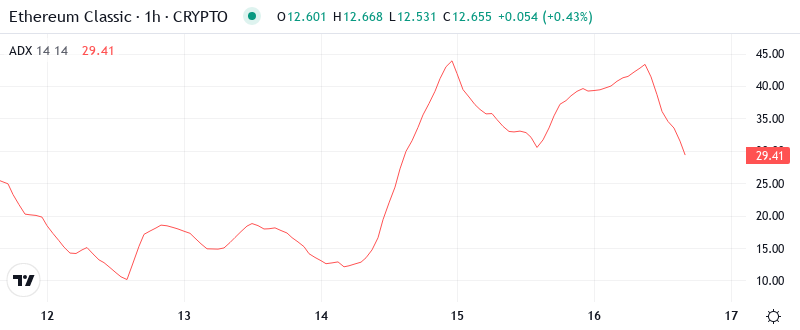
At the level of 24.14, the ADX entry indicates the market is transitioning from range-bound chop to directional movement – and given the price action, that direction is clearly down. The indicator spent most of November below 20, keeping ETC trapped in a $2 range between $13 and $15, but this month’s breakdown changed the game entirely.
Crucially, ADX readings above 25 historically coincide with ETC’s sharpest moves in either direction. The last time ADX sustained above this threshold in September, price dropped 35% in three weeks. Therefore, day traders should adapt strategies for trending conditions rather than mean reversion, as the market structure now favors continuation moves over quick reversals.
20-Day EMA at $13.36 Caps Recovery Attempts
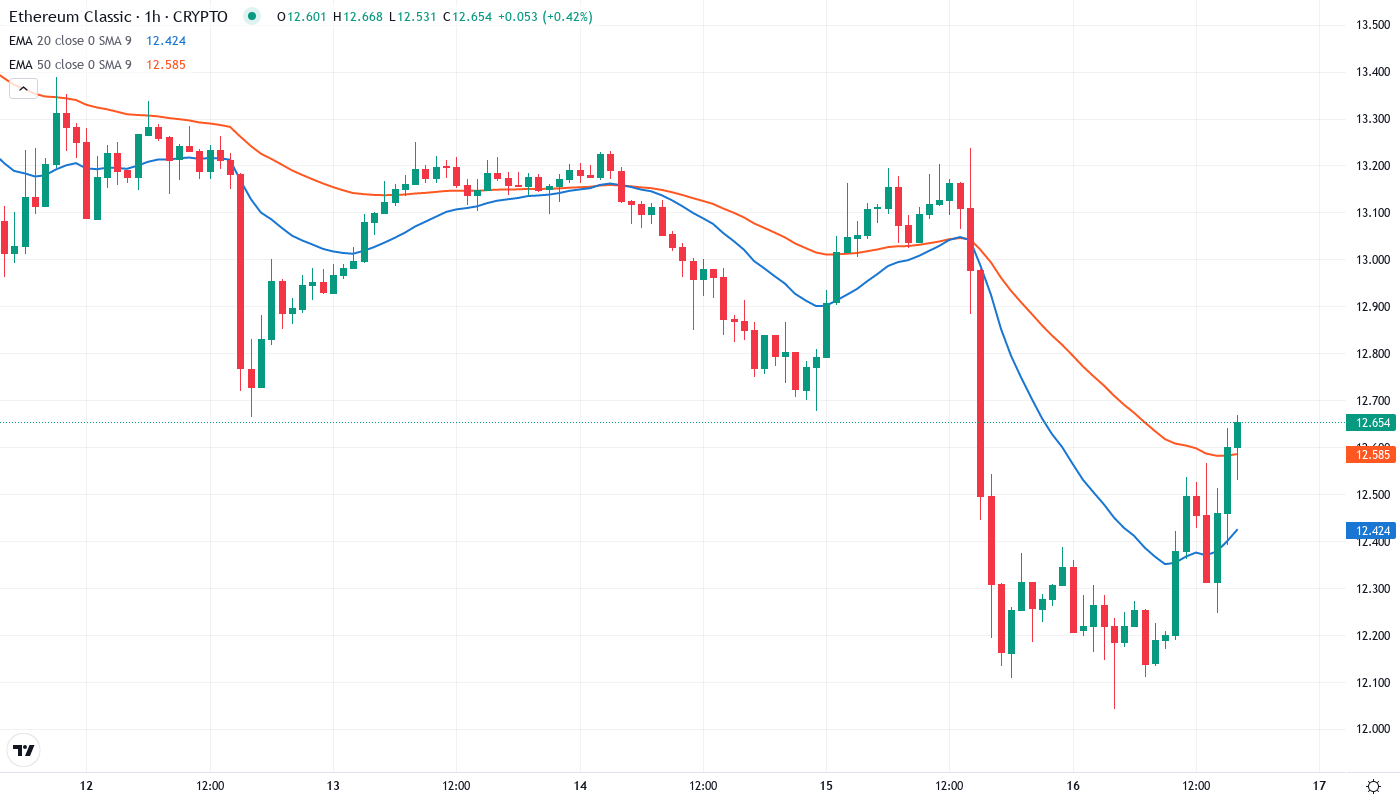
Price action tells a clear story through the EMA ribbons – ETC trades below every single moving average from the 10-day ($13.02) through the 200-day ($17.34), painting a definitively bearish picture. The 20-day EMA at $13.36 rejected two recovery attempts this week, transforming from support during November’s rally into firm resistance that bulls can’t crack.
More concerning for holders, the 50-day EMA at $14.39 sits nearly 14% above current prices, creating a massive gap that would require significant buying power to close. This complete breakdown of the moving average structure, combined with the negative headlines comparing ETC’s throughput to newer chains, suggests the path of least resistance remains lower until proven otherwise.
December Lows at $12.04 Become Final Defense Line
The immediate resistance stacks between $13.02 (10-day EMA) and $13.70 (monthly pivot), with sellers defending this zone aggressively on every bounce attempt. Above that, the psychological $15 level that capped November’s rally now looks distant, requiring a 20% move just to retest.
Bulls have successfully defended the $12.04 support level six times since June, making it the most reliable floor in ETC’s recent trading history. Each test has produced progressively weaker bounces though – November’s rebound reached $15.12, while this week’s attempt stalled at $13.45.
Market structure reveals a descending triangle pattern with that $12.04 horizontal support meeting a downward-sloping resistance line from December’s highs. This compression typically resolves with a violent move in either direction, and given the negative momentum readings, traders are positioning for a potential breakdown.
Bulls Need Decisive Close Above $13.36 to Shift Momentum
Should price reclaim the 20-day EMA at $13.36 with conviction and hold it on a retest, bulls could target the 50-day EMA at $14.39 as the next major hurdle. The technical damage is significant though – reversing this downtrend requires not just a bounce but sustained buying that pushes RSI above 50 and maintains closes above multiple resistance levels.
The bearish scenario triggers if $12.04 support fails on a daily close, especially with volume confirmation. Below that level sits an air pocket down to $10.50, representing another 17% drop with minimal support to slow the descent. Given the unfavorable comparisons to newer blockchain technologies and the complete breakdown of moving average support, this remains the higher probability outcome.
Taking current momentum indicators and market structure into account, ETC likely continues grinding between $12.04 and $13.36 until either support cracks or a significant catalyst emerges. The ADX trend-following signal combined with bearish EMA alignment suggests any bounces should be sold until the technical picture improves materially.