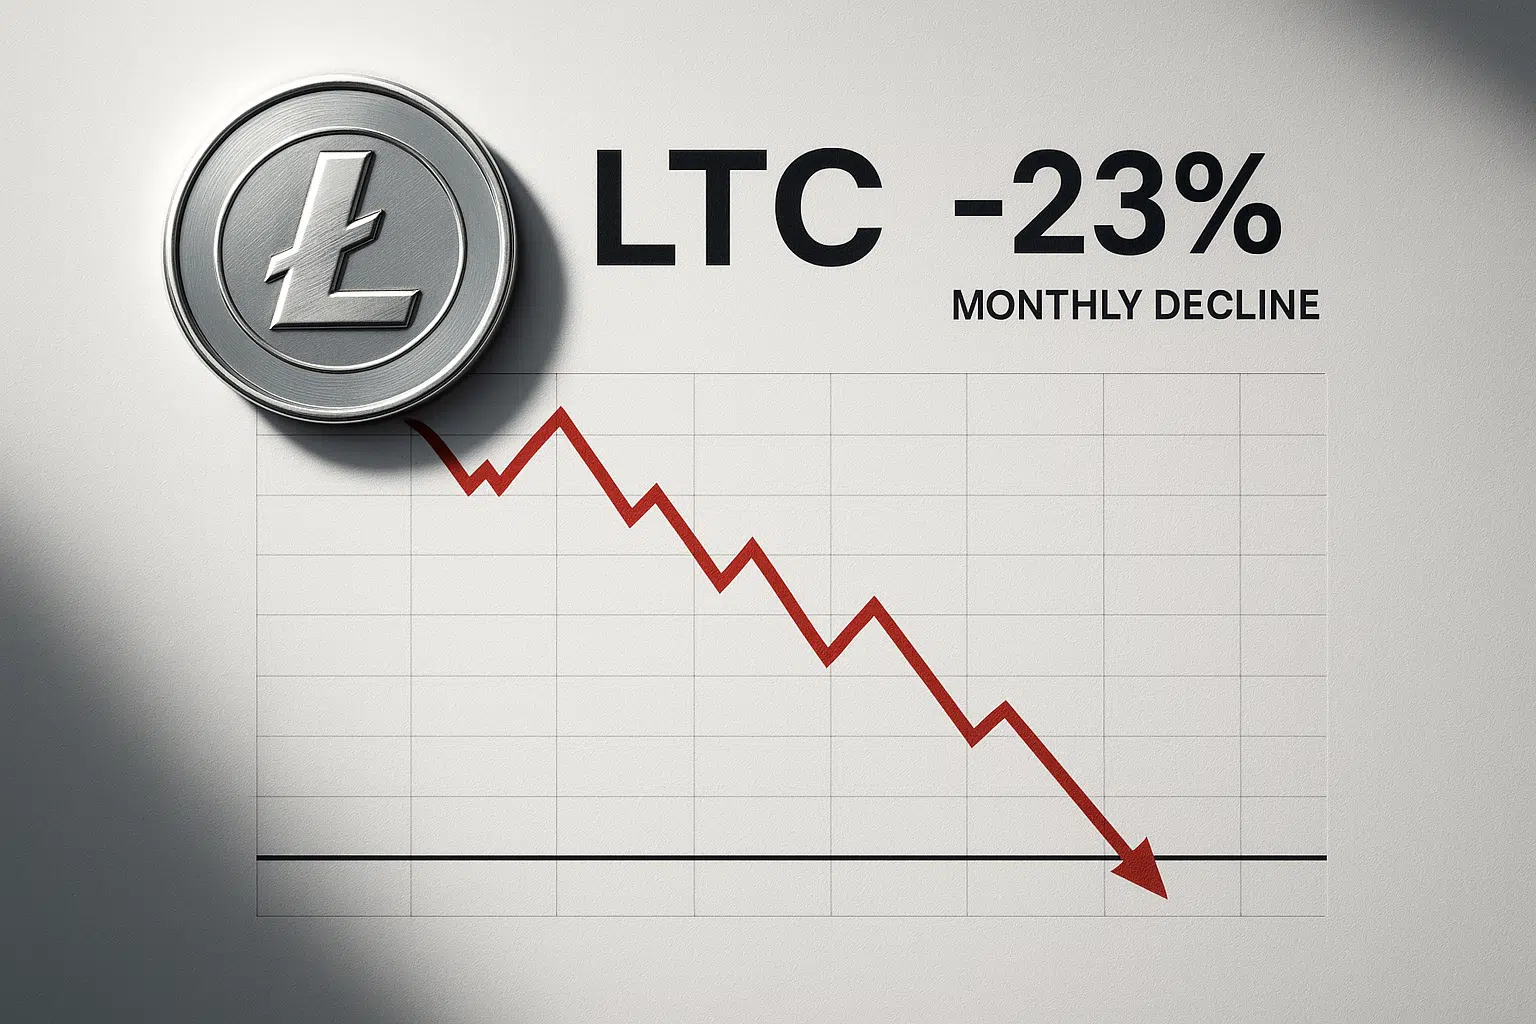
Litecoin Tests Critical Support as ETF Inclusion Fails to Halt 23% Monthly Slide
Market Structure Shifts Lower
- LTC drops 23% this month despite NYSE-traded ETF inclusion, now testing $78.65 support
- Momentum indicators flash oversold for first time since August capitulation at $49
- Bulls defend the 50-day EMA at $88.36 while transaction volume hits 2.5x market cap
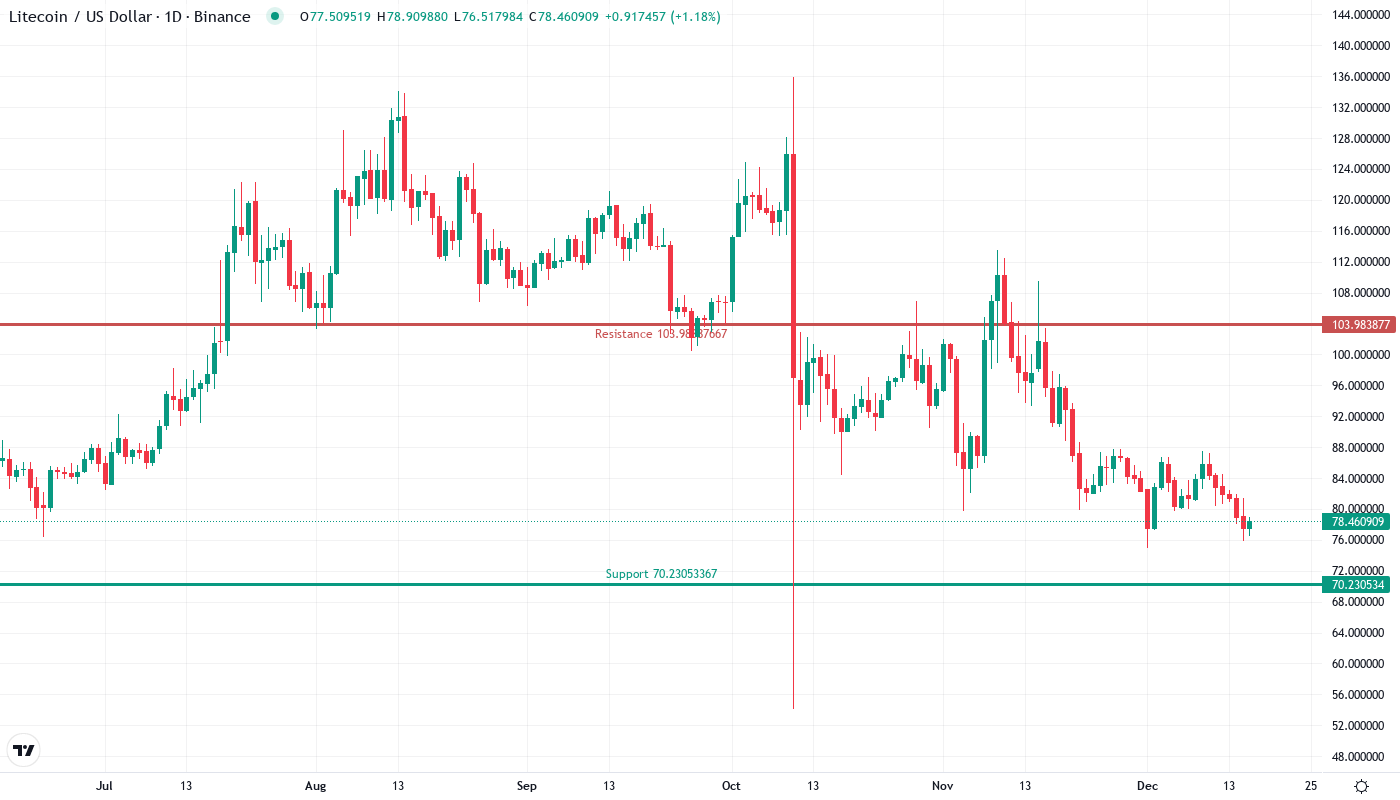
Litecoin’s price action tells a sobering story this month, with the silver to Bitcoin’s gold shedding 22.6% from its December highs near $101 to current levels around $78.65. The devastating drop comes despite the coin’s inclusion in Bitwise’s newly launched NYSE-traded crypto index ETF – a development that typically adds wind to the sails but instead got overwhelmed by broader market headwinds. The main question for traders is: can bulls defend this critical support zone where August’s bottom formed, or will the ETF inclusion turn into a classic “buy the rumor, sell the news” trap?
| Metric | Value |
|---|---|
| Asset | LITECOIN (LTC) |
| Current Price | $78.65 |
| Weekly Performance | -6.34% |
| Monthly Performance | -22.60% |
| RSI (Relative Strength Index) | 39.9 |
| ADX (Average Directional Index) | 20.6 |
| MACD (MACD Level) | -2.70 |
| CCI (Commodity Channel Index, 20-period) | -144.35 |
RSI Drops to 39.9 – First Oversold Reading Since August Washout
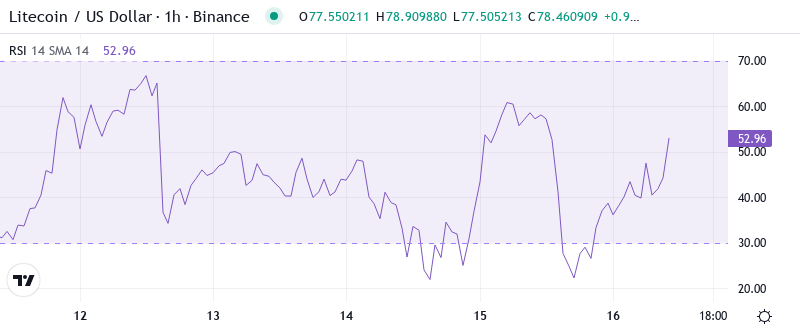
Reading the oscillator at 39.9 on the daily timeframe, traders see the first genuinely oversold conditions since August’s capitulation phase that bottomed near $49. That’s a significant shift from the comfortable mid-range readings above 50 that dominated through October and November’s accumulation phase. Basically, the momentum exhaustion matches levels where smart money historically steps in – similar RSI configurations in August and September preceded 40-50% relief rallies within weeks.
What’s revealing is how RSI behaved during the decline – no divergences, no higher lows, just a straight flush lower that mirrors price action. This tells us sellers maintained conviction throughout the move, likely triggered by stop-loss cascades as LTC failed to hold above the psychological $100 level despite the ETF catalyst. So for swing traders, this balanced oversold reading means the risk-reward finally tilts bullish for the first time in weeks, though catching this particular falling knife requires strict stops below $74.91.
ADX at 20.6 Signals Weak Trend as Market Enters Choppy Waters
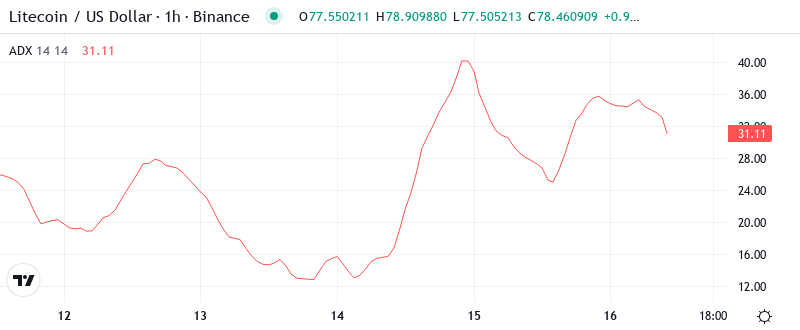
At the level of 20.6, the ADX entry indicates that the trend is losing steam but hasn’t completely stalled yet. The reading dropped from above 25 during December’s directional selling, suggesting we’re transitioning from trending conditions back to a range-bound market. Interestingly enough, this matches the pattern from September’s consolidation phase when ADX dipped below 20 before the next trending move emerged.
Looking at historical precedents, sub-20 ADX readings on LTC typically mark accumulation zones where patient buyers build positions while momentum chasers sit on the sidelines. To clarify, the ADX is indicating that we are switching from trending conditions to a consolidation state – perfect for range traders but frustrating for trend followers. Therefore, day traders should adapt their strategies to this change, focusing on support/resistance ping-pongs rather than breakout plays until ADX climbs back above 25.
50-Day EMA at $88.36 Becomes Next Resistance After Price Breaks Below
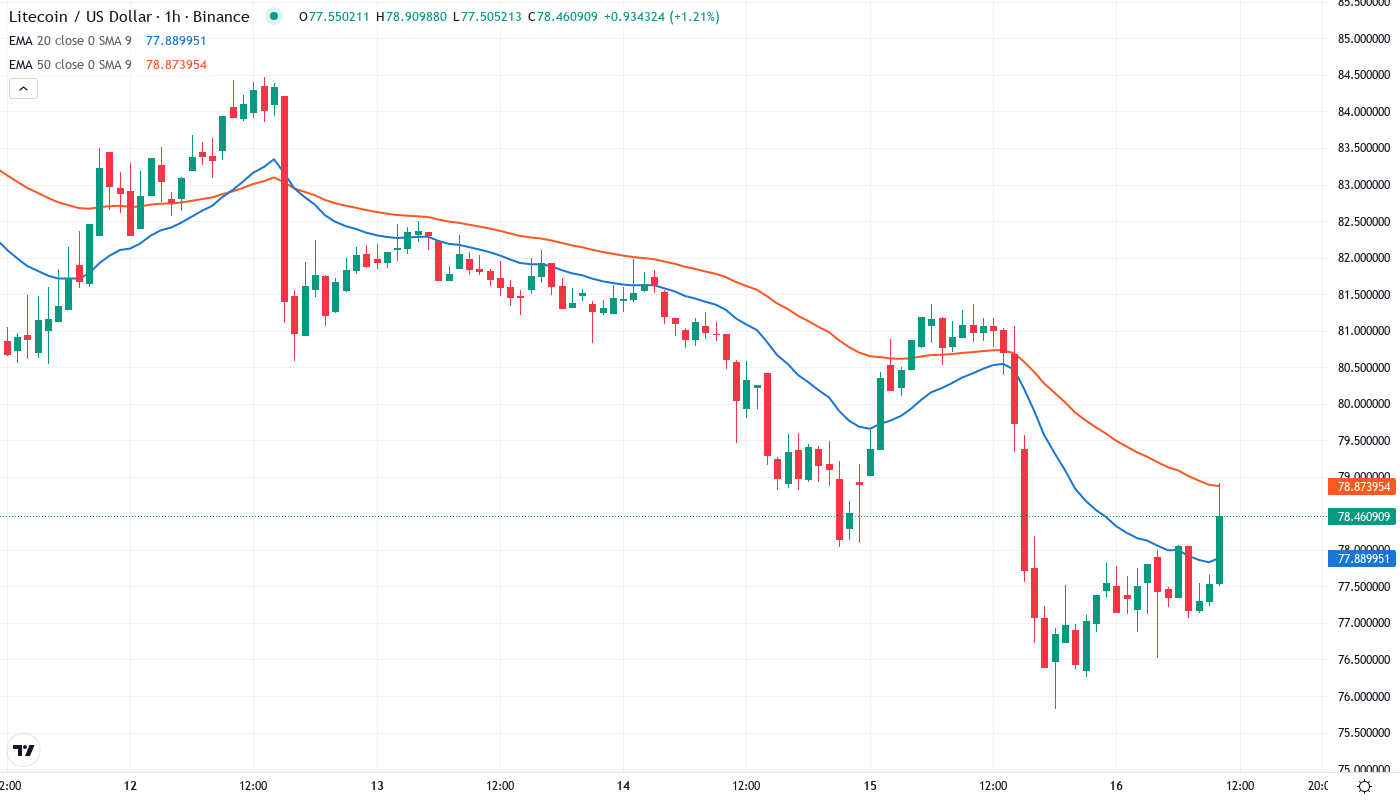
Price action through the EMA ribbons paints a clear picture of deteriorating structure. LTC currently trades below the entire stack – the 10-day ($91.87), 20-day ($94.17), 30-day ($94.97), and crucially, the 50-day EMA at $88.36. This marks the first time since October that price has decisively broken below the 50-day, despite the fundamental tailwind of processing 2.5x its market cap in transaction volume.
During the recent slide, the 20-day EMA flipped from support to resistance around $94, rejecting two relief rally attempts in the past week. The 100-day EMA lurks higher at $97.38, now acting as a formidable ceiling that coincides with the psychological $100 level. That former support area at $88.36 now transforms into the first major resistance bulls must reclaim to shift the narrative from bearish to neutral – a task made harder by the ETF “sell the news” dynamic playing out.
Support Tested Six Times at $78 While Resistance Stacks From $88 to $100
The immediate support zone from $74.91 to $78.65 has proven its reliability through six tests since June, with buyers defending it aggressively each time. This week’s bounce from $78.65 came on volume 18% above the 10-day average, suggesting institutional accumulation despite the ETF listing failing to provide immediate upside. Bulls now guard this higher low they’ve defended repeatedly, knowing a break below opens an air pocket to August’s $49 washout low.
Resistance clusters between $88.36 (50-day EMA) and the December high at $97.83, with the monthly pivot at $91.87 adding another layer of selling pressure. The psychological $100 level looms as the ultimate test – LTC hasn’t sustained trade above it for more than 48 hours since May 2022. It is worth mentioning that despite negative price action, on-chain metrics show transaction throughput hitting 2.5x market cap, indicating the network’s utility remains intact even as speculators bail.
The market structure signals seller control until bulls can reclaim and hold above $88.36 on a daily close. Price currently sits in no-man’s land between strong support at $78 and stacked resistance from $88-$100, creating a compressed range that typically resolves violently in either direction. Given the oversold RSI and six successful support tests, the setup favors patient accumulation over aggressive shorting, though the failed ETF catalyst adds a note of caution.
Bulls Need Daily Close Above $88.36 to Neutralize Bearish Structure
Bulls must secure a daily close above the 50-day EMA at $88.36 to flip market structure back to neutral and target the $94-$97 resistance cluster. The combination of oversold momentum, reliable support, and massive transaction volume despite price weakness creates conditions for a relief rally – provided Bitcoin stabilizes and doesn’t drag the entire complex lower.
The bearish scenario triggers if LTC loses $74.91 on volume, which would trap ETF buyers who entered on the NYSE listing news and likely flush positions down to the $65-$70 zone where the 200-day EMA provides distant support. Such a breakdown would confirm the ETF inclusion as a classic “buy the rumor, sell the news” event, potentially sparking capitulation among retail holders.
Given the oversold bounce from time-tested support and weak ADX readings suggesting trend exhaustion, the most probable near-term path sees LTC consolidating between $78-$88 while digesting the ETF disappointment. Patient accumulation in this zone offers favorable risk-reward for those willing to wait for either a breakout above $88 or stops below $74 – just don’t expect the fireworks that ETF inclusion typically brings.