Shiba Inu Whale Activity Surges to Six-Month High as Price Tests Critical Support

Market Structure Shifts at $0.000007
- Whale transactions hit 6-month peak while price consolidates near multi-year lows
- Over 1 trillion SHIB tokens absorbed by exchanges, signaling potential volatility ahead
- K9 Finance ultimatum adds uncertainty to ecosystem development timeline
Shiba Inu’s price action tells a tale of two markets – whale activity surges to levels not seen since June while the token itself hovers at $0.00000777, down 14% over the past month and a devastating 72% from yearly highs. The surge in large holder transactions, coupled with massive exchange inflows exceeding 1.06 trillion tokens, has created an unusual divergence between on-chain strength and price weakness. The main question for traders is: will this whale accumulation translate into a sustained bounce, or are we witnessing distribution before another leg down?
| Metric | Value |
|---|---|
| Asset | SHIBA INU (SHIB) |
| Current Price | $0.00 |
| Weekly Performance | -9.44% |
| Monthly Performance | -14.05% |
| RSI (Relative Strength Index) | 37.5 |
| ADX (Average Directional Index) | 15.8 |
| MACD (MACD Level) | 0.00 |
| CCI (Commodity Channel Index, 20-period) | -192.55 |
RSI at 37.48 Signals Oversold Territory – But Not Capitulation Yet
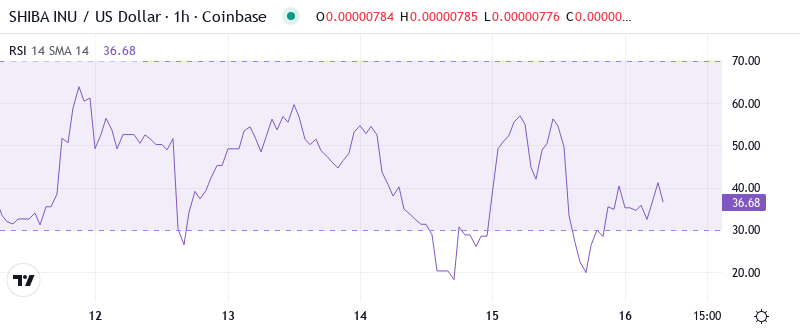
Reading the oscillator at 37.48 on the daily timeframe, traders see momentum approaching oversold conditions without quite hitting the extreme washout levels typically associated with major bottoms. This positioning suggests selling pressure has been consistent but not panic-driven – a crucial distinction for timing entries. The weekly RSI holds slightly lower at 33.97, confirming the broader downtrend while leaving room for further downside before true capitulation emerges.
What’s revealing is how RSI behaved during the recent whale accumulation phase. Despite the massive inflows and six-month high in large holder activity, momentum indicators barely budged – suggesting these whales are absorbing supply quietly rather than aggressively bidding prices higher. Similar RSI configurations in September preceded a brief 15% relief rally before continuation lower, offering a roadmap for short-term traders expecting a bounce within the broader bearish structure.
ADX at 15.84 Keeps Range Traders in Command
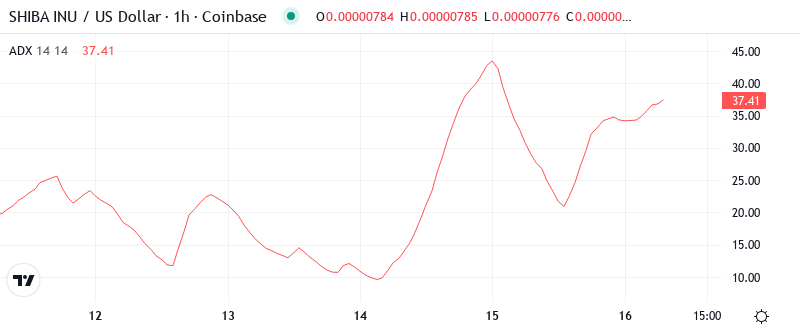
Trend strength remains conspicuously absent with ADX reading just 15.84, well below the 25 threshold that signals directional conviction. Basically, we’re stuck in a grinding consolidation where neither bulls nor bears can sustain meaningful moves. The combination of high whale activity with low trend strength creates a coiled spring effect – energy building beneath the surface without clear directional release.
To clarify, this weak ADX environment favors range-bound strategies over trend-following approaches. The K9 Finance ultimatum regarding bridge exploit reimbursements adds another layer of uncertainty that could keep prices choppy until resolution emerges. Therefore, day traders should focus on quick scalps between support and resistance rather than holding for extended moves, at least until ADX climbs above 25 to confirm a genuine trend is developing.
Price Trapped Below Entire EMA Ribbon Since Early December
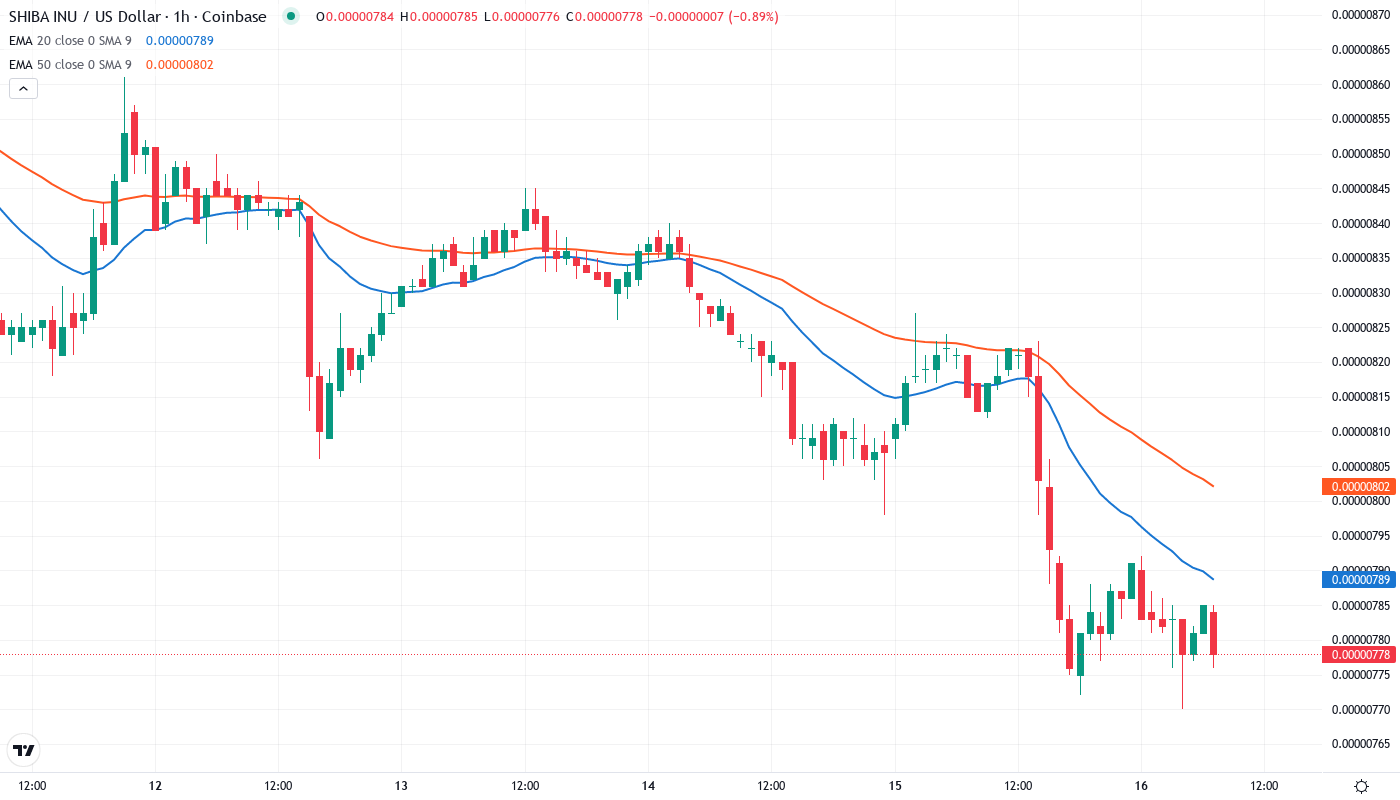
Moving average structure paints a definitively bearish picture with SHIB trading below every major EMA. Price sits beneath the 10-day ($0.00000821), 20-day ($0.00000837), and crucially, the 50-day EMA at $0.00000897. Each of these levels now acts as resistance, creating multiple barriers bulls must overcome to shift the technical picture. The 100-day EMA looms even higher at $0.00000993, representing a 28% climb from current levels.
Most significant is the compression between the 10-day and 20-day EMAs – a gap of just $0.00000016 that resembles pre-breakout formations from previous cycles. However, with price below rather than above this compression zone, the setup favors bearish resolution unless bulls can reclaim at least the 20-day EMA on volume. The massive exchange inflows reported this week suggest institutions are positioning for volatility, though the direction remains unclear until price conquers these overhead averages.
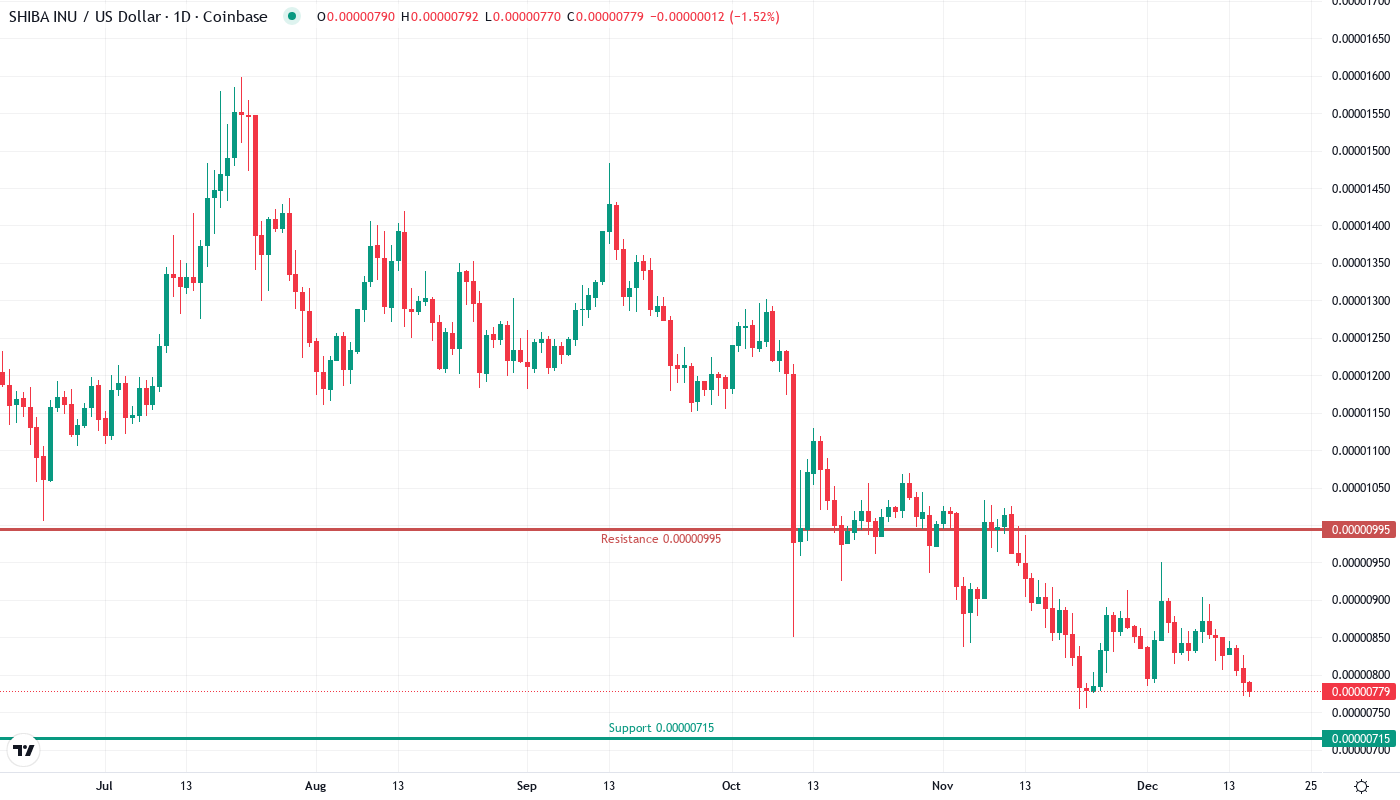
Support at $0.0000065 Becomes Final Defense Against Yearly Lows
Resistance stacks formidably between current levels and the psychological $0.00001 mark. The immediate ceiling sits at the 20-day EMA near $0.0000084, followed by the 50-day at $0.0000090. Above that, the monthly pivot at $0.0000099 converges with the 100-day EMA, creating a double barrier that rejected advances three times since November. Any sustained move above $0.00001 would require clearing multiple technical and psychological hurdles.
On the downside, support looks increasingly fragile. The $0.0000075 level provided a bounce earlier this week but lacks the volume profile of a genuine floor. Below that, only $0.0000065 stands between current price and the yearly low at $0.0000058. The 1.06 trillion token exchange inflow could pressure these supports if holders decide to liquidate rather than accumulate.
This configuration resembles a descending triangle with lower highs since October and repeated tests of the $0.0000075 support zone. Such patterns typically resolve in the direction of the prevailing trend – which remains firmly bearish. The surge in whale activity offers hope for bulls, but until price action confirms accumulation through a volume-backed breakout above the EMA ribbon, the technical structure favors continued pressure on support levels.
Whale Accumulation Sets Stage for Volatile Resolution
Bulls require a decisive close above the 20-day EMA at $0.0000084 to signal the whale accumulation phase is translating into genuine buying pressure. Such a move would target the 50-day EMA at $0.0000090 next, with the psychological $0.00001 level serving as the make-or-break zone for any sustainable rally. The combination of oversold RSI and record whale activity provides fundamental fuel if technical triggers align.
The setup fails if $0.0000075 support crumbles on volume, especially given the massive exchange inflows that could accelerate selling if triggered. A daily close below $0.0000065 would likely cascade toward yearly lows near $0.0000058, potentially flushing out remaining weak hands before any meaningful recovery attempt. The K9 Finance situation adds a wildcard element that could catalyze moves in either direction depending on resolution.
Given the technical configuration and on-chain dynamics, the most probable near-term path sees SHIB grinding between $0.0000065 and $0.0000084 while the market digests the whale positioning. The combination of oversold conditions and six-month high in large holder activity suggests accumulation is occurring, but patience will be required as this supply gets absorbed before any explosive move materializes.